📡 GEX-Based Option Trading Analysis
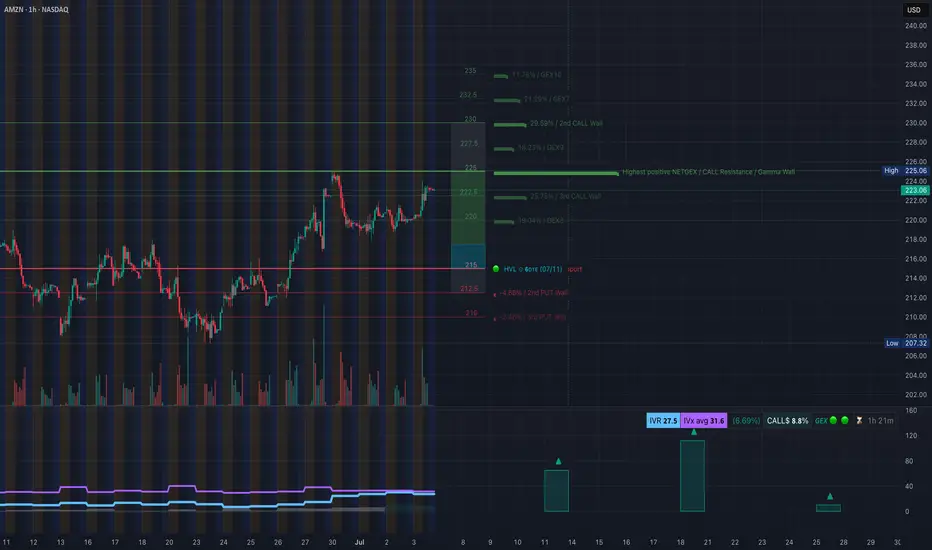
Amazon (AMZN) shows bullish option flow into next week. The GEX map highlights the following:
* Highest Net GEX sits at 225, acting as a strong magnetic price level / resistance zone.
* There’s a Call Wall cluster at 225–230, which could cap short-term upside unless we break through with strong momentum.
* IVR: 27.5 — moderately elevated, giving decent premium for calls.
* Calls: 8.8% vs. Puts: neutral – bullish skew with gamma support underneath.
* Support zone: 215–213 (GEX floor + HVL + PUT wall).
* A break above 226 opens doors to a potential squeeze into 230–232.
🟢 Trade Idea for Options:
* Directional Bullish Bias above 223.
* Consider buying July 12th 225C or vertical 223/230C debit spread for a lower risk play.
* Use tight stop if price fades below 219.75.
📈 1-Hour Chart Technical Setup

From the 1H chart:
* AMZN broke structure (BOS) above 223 and reclaimed the trendline.
* Price has broken out of the previous supply zone (highlighted in purple) and is retesting it now.
* 9/21 EMA shows bullish crossover; price holds above trendline with rising volume.
* Strong support confluence around 219–221 from CHoCH, EMA, and structure lows.
* Bias remains bullish continuation as long as price holds 221.60–222.
🧠 Scalping Plan (Intraday):
* Long setup: Look for retest entry at 223.00 or 222.50, stop below 221.50, target 225.60, then 227.50.
* Avoid chasing if price gaps above 226. Wait for retrace back into structure.
* Bearish invalidation only below 219.
🎯 Final Thoughts:
* AMZN is entering a gamma-rich zone. Watch 225 reaction — breakout could spark a run to 230+.
* Options look primed for bullish plays. Chart structure supports a breakout continuation.
* Trade with tight stop-losses, especially ahead of CPI next week.
This analysis is for educational purposes only and does not constitute financial advice. Always manage risk and do your own research.
Amazon (AMZN) shows bullish option flow into next week. The GEX map highlights the following:
* Highest Net GEX sits at 225, acting as a strong magnetic price level / resistance zone.
* There’s a Call Wall cluster at 225–230, which could cap short-term upside unless we break through with strong momentum.
* IVR: 27.5 — moderately elevated, giving decent premium for calls.
* Calls: 8.8% vs. Puts: neutral – bullish skew with gamma support underneath.
* Support zone: 215–213 (GEX floor + HVL + PUT wall).
* A break above 226 opens doors to a potential squeeze into 230–232.
🟢 Trade Idea for Options:
* Directional Bullish Bias above 223.
* Consider buying July 12th 225C or vertical 223/230C debit spread for a lower risk play.
* Use tight stop if price fades below 219.75.
📈 1-Hour Chart Technical Setup
From the 1H chart:
* AMZN broke structure (BOS) above 223 and reclaimed the trendline.
* Price has broken out of the previous supply zone (highlighted in purple) and is retesting it now.
* 9/21 EMA shows bullish crossover; price holds above trendline with rising volume.
* Strong support confluence around 219–221 from CHoCH, EMA, and structure lows.
* Bias remains bullish continuation as long as price holds 221.60–222.
🧠 Scalping Plan (Intraday):
* Long setup: Look for retest entry at 223.00 or 222.50, stop below 221.50, target 225.60, then 227.50.
* Avoid chasing if price gaps above 226. Wait for retrace back into structure.
* Bearish invalidation only below 219.
🎯 Final Thoughts:
* AMZN is entering a gamma-rich zone. Watch 225 reaction — breakout could spark a run to 230+.
* Options look primed for bullish plays. Chart structure supports a breakout continuation.
* Trade with tight stop-losses, especially ahead of CPI next week.
This analysis is for educational purposes only and does not constitute financial advice. Always manage risk and do your own research.
Disclaimer
The information and publications are not meant to be, and do not constitute, financial, investment, trading, or other types of advice or recommendations supplied or endorsed by TradingView. Read more in the Terms of Use.
Disclaimer
The information and publications are not meant to be, and do not constitute, financial, investment, trading, or other types of advice or recommendations supplied or endorsed by TradingView. Read more in the Terms of Use.