The recent price action for Amazon (AMZN) is currently navigating a critical juncture, having pulled back from a significant resistance level and now consolidating within a pivotal "Deciding Area." A detailed review of the key technical levels reveals the following insights:
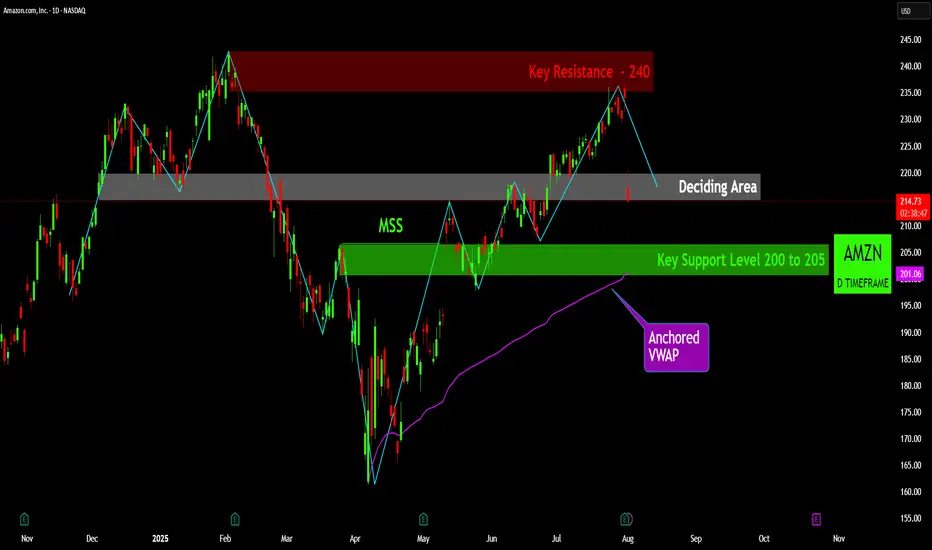
Key Resistance ($240): A formidable resistance zone is established around the $240 price point. This level represents a major overhead supply area, where prior selling pressure has been strong enough to halt upward price movements on multiple occasions. A decisive breach of this level on strong volume would be a highly bullish development, signaling a potential move to new highs.
Key Support Level ($200 to $205): A robust support zone is identified between $200 and $205. This level has historically served as a strong price floor, absorbing selling pressure and providing a foundation for subsequent rallies. The integrity of the current uptrend is heavily dependent on the price holding above this critical area.
Market Structure Shift (MSS): The formation of a "Market Structure Shift" earlier in the year was a pivotal technical event. This change in market dynamics marked a significant transition, signaling a potential reversal from a prevailing downtrend to the current bullish phase. The subsequent rally from the lows validates this structural change.
Anchored VWAP: The Anchored Volume-Weighted Average Price (VWAP), anchored from the most recent major low, is serving as a dynamic and trend-defining support level. This indicator reflects the average price paid by investors since the start of the current trend. A sustained close below this line would be an early warning sign of weakening momentum.
Deciding Area: The stock is presently trading within a "Deciding Area" situated just below a previous swing high. This zone represents a period of consolidation and indecision as the market digests the recent pullback from resistance. The outcome of this consolidation will likely dictate the short-term directional bias. A break to the upside would suggest a renewed attempt to challenge the $240 resistance, while a breakdown would likely lead to a retest of the primary support level at $200-$205.
Summary of Outlook: The overall technical picture for AMZN indicates that the stock is at a critical inflection point. The health of the underlying uptrend remains intact as long as the price holds above the key support levels and the Anchored VWAP. A definitive move out of the "Deciding Area" will provide the next clear signal for either a renewed push toward resistance or a deeper pullback to test established support.
Disclaimer:
The information provided in this chart is for educational and informational purposes only and should not be considered as investment advice. Trading and investing involve substantial risk and are not suitable for every investor. You should carefully consider your financial situation and consult with a financial advisor before making any investment decisions. The creator of this chart does not guarantee any specific outcome or profit and is not responsible for any losses incurred as a result of using this information. Past performance is not indicative of future results. Use this information at your own risk. This chart has been created for my own improvement in Trading and Investment Analysis. Please do your own analysis before any investments.
Disclaimer
The information and publications are not meant to be, and do not constitute, financial, investment, trading, or other types of advice or recommendations supplied or endorsed by TradingView. Read more in the Terms of Use.
Disclaimer
The information and publications are not meant to be, and do not constitute, financial, investment, trading, or other types of advice or recommendations supplied or endorsed by TradingView. Read more in the Terms of Use.