Hello?
Dear traders, nice to meet you.
"Like" is a huge force for me.
By "following" you can always get new information quickly.
Thank you for always supporting me.
-------------------------------------------------- -----
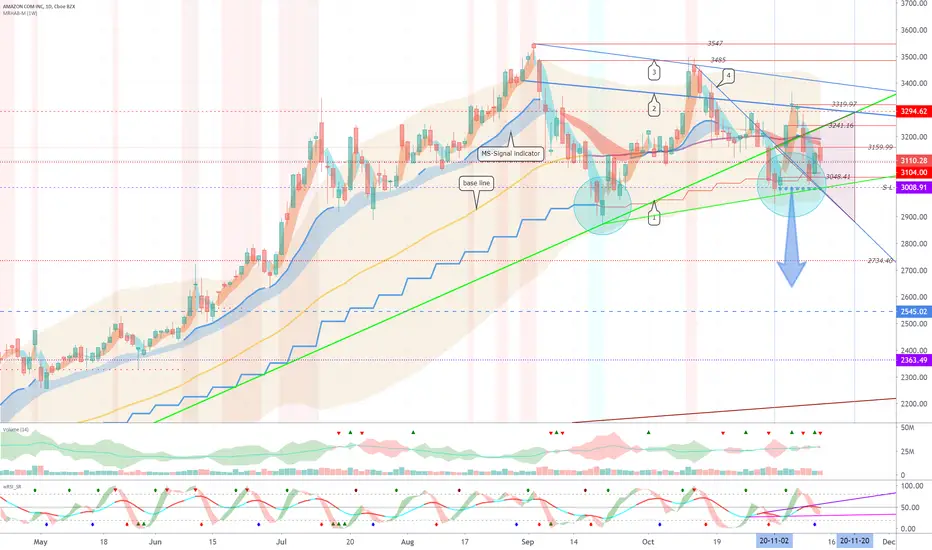
The gap (3050.0-3159.95) started higher and closed lower.
You need to make sure you get support at point 3104.0.
If it gains support and rises between 3008.91-3104.0, it is expected to rise along the uptrend line (1).
Therefore, I think the current position is an important position to determine the future flow.
---------------------------------------
(DJI 1D chart)

It started with a decline in the gap (29397.6-29231.9) and closed at -1.08%.
We have to see if we can get support and climb at 28989.7.
---------------------------------------
(IXIC 1D chart)

It started with the gap (11786.4-11802.5) rising and closed at -0.65%.
We need to see if it can rise along the uptrend line (2).
------------------------------------------
(SPX 1D chart)

It started with the gap (3572.7-3562.7) falling and closed at -1.0%.
-----------------------------------------
(GOLD 1D chart)

It started with the gap (25.79-26.02) rising and closed at 0.47%.
We must see if we can get support above the 25.75 point and break above the downtrend line.
-------------------------------------------------- -------------------------------------------
** Check support, resistance, and abbreviation points.
** Support or resistance is based on the closing price of the 1D chart.
** All explanations are for reference only and do not guarantee profit or loss on investment.
Explanation of abbreviations displayed on the chart
R: A point or section of resistance that requires a response to preserve profits
S-L: Stop-Loss point or section
S: A point or segment that can be bought for profit generation as a support point or segment
(Short-term Stop Loss can be said to be a point where profits and losses can be preserved or additionally entered through installment trading. You should trade from a short-term investment perspective.)
GAP refers to the difference in prices that occurred when the stock market, CME and BAKKT exchanges were closed because they are not trading 24 hours a day.
G1: Closed price
G2: Market price at the time of opening
Dear traders, nice to meet you.
"Like" is a huge force for me.
By "following" you can always get new information quickly.
Thank you for always supporting me.
-------------------------------------------------- -----
The gap (3050.0-3159.95) started higher and closed lower.
You need to make sure you get support at point 3104.0.
If it gains support and rises between 3008.91-3104.0, it is expected to rise along the uptrend line (1).
Therefore, I think the current position is an important position to determine the future flow.
---------------------------------------
(DJI 1D chart)
It started with a decline in the gap (29397.6-29231.9) and closed at -1.08%.
We have to see if we can get support and climb at 28989.7.
---------------------------------------
(IXIC 1D chart)
It started with the gap (11786.4-11802.5) rising and closed at -0.65%.
We need to see if it can rise along the uptrend line (2).
------------------------------------------
(SPX 1D chart)
It started with the gap (3572.7-3562.7) falling and closed at -1.0%.
-----------------------------------------
(GOLD 1D chart)
It started with the gap (25.79-26.02) rising and closed at 0.47%.
We must see if we can get support above the 25.75 point and break above the downtrend line.
-------------------------------------------------- -------------------------------------------
** Check support, resistance, and abbreviation points.
** Support or resistance is based on the closing price of the 1D chart.
** All explanations are for reference only and do not guarantee profit or loss on investment.
Explanation of abbreviations displayed on the chart
R: A point or section of resistance that requires a response to preserve profits
S-L: Stop-Loss point or section
S: A point or segment that can be bought for profit generation as a support point or segment
(Short-term Stop Loss can be said to be a point where profits and losses can be preserved or additionally entered through installment trading. You should trade from a short-term investment perspective.)
GAP refers to the difference in prices that occurred when the stock market, CME and BAKKT exchanges were closed because they are not trading 24 hours a day.
G1: Closed price
G2: Market price at the time of opening
Note
(NDAQ 1D chart)You need to make sure you get support at point 127.03.
If you go down from 127.03, you can touch 118.83, so you need to trade carefully.
If you gain support and climb in the 127.03-128.87 section, you can enter the section.
Note
(NFLX 1D chart)You need to make sure you get support at point 485.23.
If it deviates from the downtrend line (3), it is expected to break above the uptrend line (2).
If you fall from the 485.23 point, you can touch the 465.91 point, which requires careful trading.
Note
(NIO 1D chart)It started with the gap (43.08-44.48) rising and closed at 12.12%.
The volatility around November 12th (November 11th-13th) is showing a significant increase.
If it falls below the 44.48 point, it is a short-term Stop Loss.
It remains to be seen if it will touch the uptrend line (1).
Note
(AAPL 1D chart)It breaks above the 117.95 point and maintains the price above the 117.95 point.
We have to see if we can get support above 117.95 and climb above 120.96.
It remains to be seen if it can turn the trend with an upside once more.
If you go down from 115.32, you can touch 106.84, so you need to trade carefully.
Note
(TWTR 1D chart)We have to see if we can get support at 42.63 and ascend towards 45.33.
Note
(FORD (F) 1D chart)You should check if you can break above the 8.10-8.80 section, which is an important volume profile section.
If you go down at 8.10, you can touch 6.97, so you need to trade carefully.
Note
(FB 1D chart)You need to see if you can move up on the uptrend line (1)-(2), the expanding uptrend channel.
Note
(MSFT 1D chart)You need to make sure you can get support above the 216.23 point.
To do that, we need to see if we can break above the downtrend line.
If you are supported at 216.23, it is a possible entry point.
It remains to be seen if there can be a rebound from the short-term downtrend.
Note
(VALE 1D chart)It started with the gap (11.84-11.72) lower and closed below 11.55.
We will see if we can get support above the 11.33 point and continue the upward trend.
If you fall below the downtrend line (3), you can touch the 10.55 point, so you need to trade carefully.
If you gain support and rise from 10.41-10.55, you can enter.
However, if it goes down, it can go down to 9.53.
Other content (coins, stocks, etc.) is frequently posted on X.
X에 다른 내용(코인, 주식 등)이 자주 게시.
◆ t.me/readCryptoChannel
[HA-MS Indicator]
bit.ly/3YxHgvN
[OBV Indicator]
bit.ly/4dcyny3
X에 다른 내용(코인, 주식 등)이 자주 게시.
◆ t.me/readCryptoChannel
[HA-MS Indicator]
bit.ly/3YxHgvN
[OBV Indicator]
bit.ly/4dcyny3
Related publications
Disclaimer
The information and publications are not meant to be, and do not constitute, financial, investment, trading, or other types of advice or recommendations supplied or endorsed by TradingView. Read more in the Terms of Use.