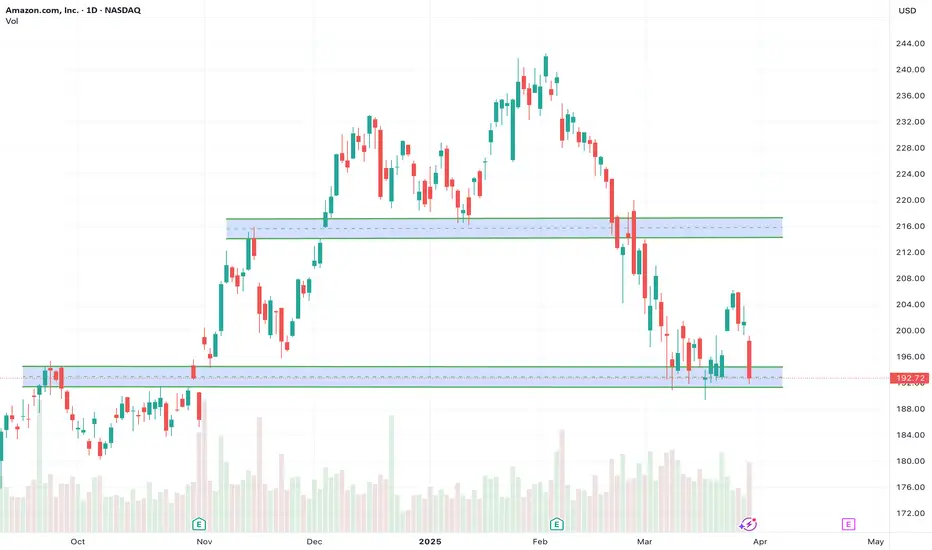
Amazon's chart is hanging around $192. Think of this zone as a tug-of-war between buyers and sellers. It's acted as support before, but can it hold again? If it fails, look out below! On the upside, cracking through the $216 resistance could signal a breakout. Will Amazon finally break free, or is it destined for more sideways action? What's your game plan? Are you accumulating near support or waiting for a clear breakout?
Disclaimer
The information and publications are not meant to be, and do not constitute, financial, investment, trading, or other types of advice or recommendations supplied or endorsed by TradingView. Read more in the Terms of Use.
Disclaimer
The information and publications are not meant to be, and do not constitute, financial, investment, trading, or other types of advice or recommendations supplied or endorsed by TradingView. Read more in the Terms of Use.