Overview:
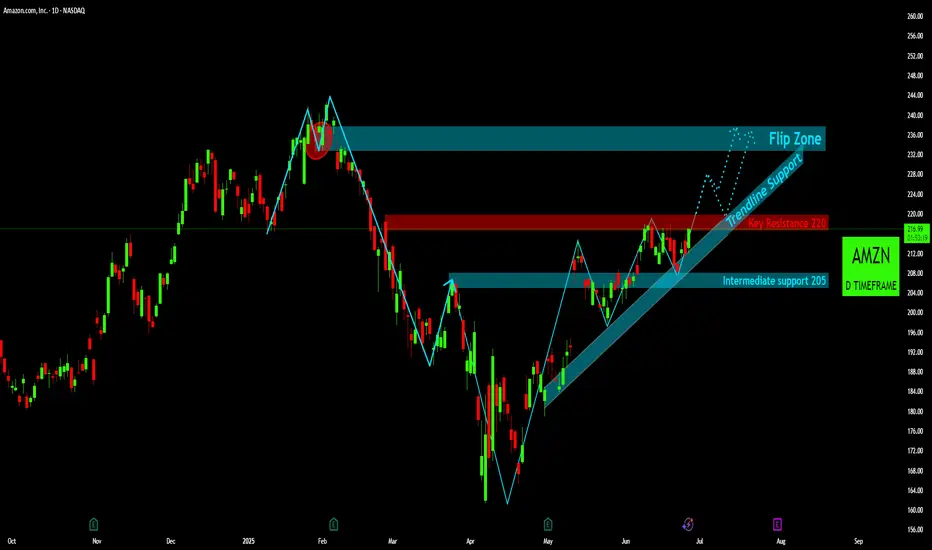
After a significant downtrend from its early February highs (a move initiated after breaking down from the "Flip Zone" around 232−238), Amazon ( AMZN) found a strong bottom in late April. Since then, the stock has been in a well-defined uptrend, characterized by a consistent series of higher lows and higher highs.
Current Market Structure:
The price action is clearly respecting an ascending "Trendline Support" (the shaded teal channel), indicating underlying bullish strength. Each pullback has found buyers around this trendline or the identified support levels.
Key Levels to Watch:
Key Resistance 220 (Red Zone):
This is the most immediate and critical hurdle for AMZN.
The price has tested this level multiple times in recent weeks (late May and mid-June) and faced strong rejections, indicating significant selling pressure or profit-taking at this psychological and technical barrier.
A decisive break and sustained close above $220 would be a highly bullish signal, suggesting a continuation of the uptrend.
Intermediate Support 205 (Lower Teal Zone):
This level has proven to be reliable support during recent pullbacks (early June and late June).
It acts as a key pivot point; as long as price holds above $205, the bullish structure remains intact.
Flip Zone (232-238 - Upper Teal Zone):
This zone is crucial from a historical perspective. It acted as strong support in early February before the major breakdown. After breaking, it effectively "flipped" to resistance (as seen with the red circle showing a rejection).
If AMZN successfully breaks above the "Key Resistance 220," this "Flip Zone" will likely be the next major target for buyers and a potential area for sellers to emerge.
Disclaimer:
The information provided in this chart is for educational and informational purposes only and should not be considered as investment advice. Trading and investing involve substantial risk and are not suitable for every investor. You should carefully consider your financial situation and consult with a financial advisor before making any investment decisions. The creator of this chart does not guarantee any specific outcome or profit and is not responsible for any losses incurred as a result of using this information. Past performance is not indicative of future results. Use this information at your own risk. This chart has been created for my own improvement in Trading and Investment Analysis. Please do your own analysis before any investments.
After a significant downtrend from its early February highs (a move initiated after breaking down from the "Flip Zone" around 232−238), Amazon (
Current Market Structure:
The price action is clearly respecting an ascending "Trendline Support" (the shaded teal channel), indicating underlying bullish strength. Each pullback has found buyers around this trendline or the identified support levels.
Key Levels to Watch:
Key Resistance 220 (Red Zone):
This is the most immediate and critical hurdle for AMZN.
The price has tested this level multiple times in recent weeks (late May and mid-June) and faced strong rejections, indicating significant selling pressure or profit-taking at this psychological and technical barrier.
A decisive break and sustained close above $220 would be a highly bullish signal, suggesting a continuation of the uptrend.
Intermediate Support 205 (Lower Teal Zone):
This level has proven to be reliable support during recent pullbacks (early June and late June).
It acts as a key pivot point; as long as price holds above $205, the bullish structure remains intact.
Flip Zone (232-238 - Upper Teal Zone):
This zone is crucial from a historical perspective. It acted as strong support in early February before the major breakdown. After breaking, it effectively "flipped" to resistance (as seen with the red circle showing a rejection).
If AMZN successfully breaks above the "Key Resistance 220," this "Flip Zone" will likely be the next major target for buyers and a potential area for sellers to emerge.
Disclaimer:
The information provided in this chart is for educational and informational purposes only and should not be considered as investment advice. Trading and investing involve substantial risk and are not suitable for every investor. You should carefully consider your financial situation and consult with a financial advisor before making any investment decisions. The creator of this chart does not guarantee any specific outcome or profit and is not responsible for any losses incurred as a result of using this information. Past performance is not indicative of future results. Use this information at your own risk. This chart has been created for my own improvement in Trading and Investment Analysis. Please do your own analysis before any investments.
Disclaimer
The information and publications are not meant to be, and do not constitute, financial, investment, trading, or other types of advice or recommendations supplied or endorsed by TradingView. Read more in the Terms of Use.
Disclaimer
The information and publications are not meant to be, and do not constitute, financial, investment, trading, or other types of advice or recommendations supplied or endorsed by TradingView. Read more in the Terms of Use.