Technical Analysis Overview:
4-Hour Chart:
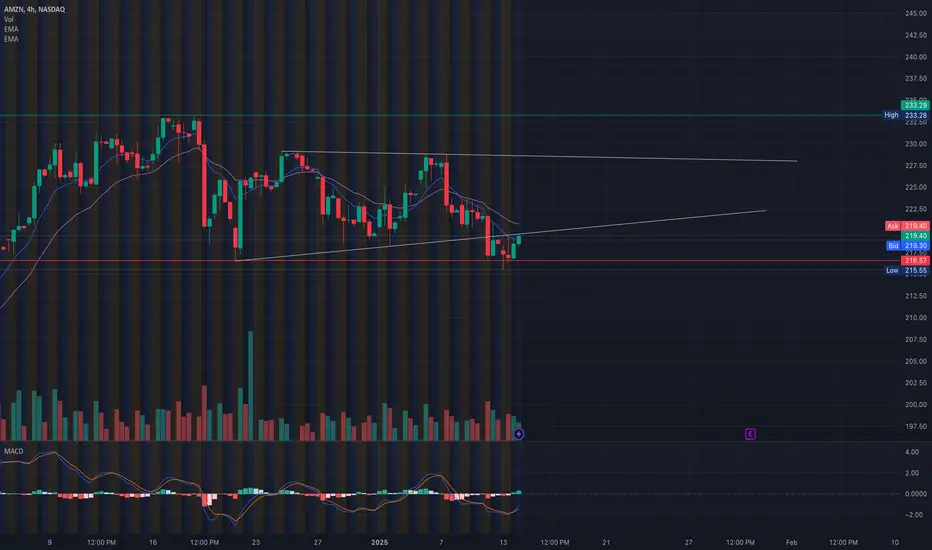
* Trend: AMZN has recently rebounded from its lower trendline, showing early signs of stabilization.
* Indicators:
* EMA (9/21): Price is testing the 9 EMA, while the 21 EMA is still above, acting as dynamic resistance.
* MACD: Displays a potential bullish crossover, but momentum remains weak for now.
30-Minute Chart:
* Price Action:
* Consolidation near $217-$219 indicates a battle between buyers and sellers.
* Resistance lies around $220, coinciding with the highest positive NETGEX level.
* Volume: Volume remains subdued, signaling the need for stronger participation to break resistance.
Key Levels to Watch:
Support Levels:
* $217: Immediate support and gamma level.
* $212.5: Strong PUT support zone.
Resistance Levels:
* $220: Key gamma resistance (highest positive NETGEX level).
* $227.5: Next resistance level, coinciding with GEX7.
* $230-$233: Strong CALL walls, marking major upside barriers.
GEX Insights:

Key Gamma Levels:
* Positive Gamma Walls (Resistance):
* $220: Highest positive NETGEX and immediate resistance.
* $227.5: 57.28% GEX7.
* $230: 83.61% (2nd CALL Wall).
* Negative Gamma Levels (Support):
* $212.5: Significant PUT support (-16.14% GEX).
* $202.5: 3rd PUT Wall (-4.5% GEX).
Options Metrics:
* IVR: 66.2, signaling moderate implied volatility.
* IVx: 37.5, slightly below average, suggesting mild price fluctuations.
* Call/Put Bias: Calls represent 12.3%, highlighting a neutral to bearish sentiment.
Trade Scenarios:
Bullish Scenario:
* Entry: Above $220 with volume confirmation.
* Target: $227.5-$230.
* Stop-Loss: Below $217 to control risk.
Bearish Scenario:
* Entry: Rejection at $220 or failure to sustain above.
* Target: $212.5-$210.
* Stop-Loss: Above $227.5 to avoid extended losses.
Directional Bias:
* The near-term outlook for AMZN hinges on whether it can decisively break above $220. Bulls need strong volume to overcome gamma resistance, while bears will likely defend this level aggressively.
Conclusion:
AMZN is at a critical inflection point around $220. Traders should watch for a breakout or rejection at this level to determine the next move. The gamma landscape highlights $227.5 and $230 as significant resistance zones, with $212.5 providing strong support.
Disclaimer: This analysis is for educational purposes only and does not constitute financial advice. Always conduct your research and trade responsibly.
4-Hour Chart:
* Trend: AMZN has recently rebounded from its lower trendline, showing early signs of stabilization.
* Indicators:
* EMA (9/21): Price is testing the 9 EMA, while the 21 EMA is still above, acting as dynamic resistance.
* MACD: Displays a potential bullish crossover, but momentum remains weak for now.
30-Minute Chart:
* Price Action:
* Consolidation near $217-$219 indicates a battle between buyers and sellers.
* Resistance lies around $220, coinciding with the highest positive NETGEX level.
* Volume: Volume remains subdued, signaling the need for stronger participation to break resistance.
Key Levels to Watch:
Support Levels:
* $217: Immediate support and gamma level.
* $212.5: Strong PUT support zone.
Resistance Levels:
* $220: Key gamma resistance (highest positive NETGEX level).
* $227.5: Next resistance level, coinciding with GEX7.
* $230-$233: Strong CALL walls, marking major upside barriers.
GEX Insights:
Key Gamma Levels:
* Positive Gamma Walls (Resistance):
* $220: Highest positive NETGEX and immediate resistance.
* $227.5: 57.28% GEX7.
* $230: 83.61% (2nd CALL Wall).
* Negative Gamma Levels (Support):
* $212.5: Significant PUT support (-16.14% GEX).
* $202.5: 3rd PUT Wall (-4.5% GEX).
Options Metrics:
* IVR: 66.2, signaling moderate implied volatility.
* IVx: 37.5, slightly below average, suggesting mild price fluctuations.
* Call/Put Bias: Calls represent 12.3%, highlighting a neutral to bearish sentiment.
Trade Scenarios:
Bullish Scenario:
* Entry: Above $220 with volume confirmation.
* Target: $227.5-$230.
* Stop-Loss: Below $217 to control risk.
Bearish Scenario:
* Entry: Rejection at $220 or failure to sustain above.
* Target: $212.5-$210.
* Stop-Loss: Above $227.5 to avoid extended losses.
Directional Bias:
* The near-term outlook for AMZN hinges on whether it can decisively break above $220. Bulls need strong volume to overcome gamma resistance, while bears will likely defend this level aggressively.
Conclusion:
AMZN is at a critical inflection point around $220. Traders should watch for a breakout or rejection at this level to determine the next move. The gamma landscape highlights $227.5 and $230 as significant resistance zones, with $212.5 providing strong support.
Disclaimer: This analysis is for educational purposes only and does not constitute financial advice. Always conduct your research and trade responsibly.
Disclaimer
The information and publications are not meant to be, and do not constitute, financial, investment, trading, or other types of advice or recommendations supplied or endorsed by TradingView. Read more in the Terms of Use.
Disclaimer
The information and publications are not meant to be, and do not constitute, financial, investment, trading, or other types of advice or recommendations supplied or endorsed by TradingView. Read more in the Terms of Use.