AMZN Earnings Flush — Gamma Flip to the Downside, Eyes on $215 Support!
🔍 GEX & Options Flow Insight (1st Image Analysis)
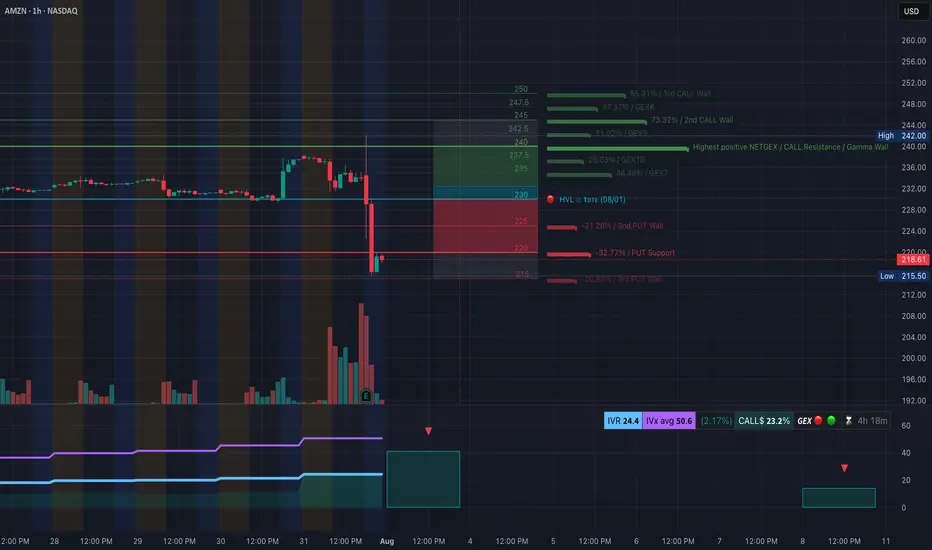
AMZN collapsed post-earnings, breaking through major gamma support levels and flipping into a negative gamma environment. Price is now pressing against a critical $215–218 demand zone, with GEX showing heavy put concentration.
* Call Walls & Resistance:
* 📍 $230.00–$234.00 → Former gamma pivot now acting as strong resistance
* 📍 $237.50 → Prior support zone; now a sell wall
* 📍 $244.00 → Highest Positive NET GEX / Gamma Wall (too far for immediate recovery unless momentum shifts)
* Put Walls & Support Zones:
* 🛡️ $222.18 → 2nd Put Wall resistance-turned-support
* 🚨 $218.00 → Current price — key defense line
* 📉 $215.50 → Hard put wall support — losing this could accelerate selloff toward $210
* Volatility Insight:
* IVR 24.4, IVx Avg 50.6 → Elevated IV post-earnings
* Call flow 23.2% → Bearish options flow bias
* GEX sentiment: 🔴🟡🔴 = Negative gamma = higher volatility risk to downside
✅ Option Trading Suggestion:
Bias: Bearish unless AMZN reclaims $224+ Strategy: Bear put spread
* Entry Idea: Buy 220P / Sell 215P for Aug 2 or Aug 9 expiry
* Invalidation: Strong daily close above $224
* Target: $215 → $210
Why this works: Negative gamma positioning means market makers hedge by selling into weakness, accelerating downside moves. The inability to reclaim $224 confirms the bearish structure.
🧠 Technical Analysis (1H Chart) (2nd Image Analysis)

Market Structure & SMC:
* 🟥 CHoCH confirmed after earnings drop
* ❌ Lost all recent BOS levels in one sharp flush
* Price trapped under former OB resistance at $224–230
Trendline Dynamics:
* Broke out of prior bullish channel to the downside
* New descending channel forming with lower highs
SMC Zones:
* 🟩 Demand Zone: $215.50–$218.00 → Immediate defense
* 🟥 Supply Zone (Purple Box): $224–$230 → Sell wall
🔄 Price Action & Key Levels
* Support:
* ✅ $218.00 → Current defense
* ✅ $215.50 → Last line of gamma support
* 🚨 Below $215.50 → Sell momentum can accelerate to $210
* Resistance:
* 🚩 $224.00 → First reclaim needed for relief rally
* 🚩 $230.00–$234.00 → Heavy resistance
🧭 Scalping / Intraday Trade Setup
🟥 Bearish Setup (Preferred):
* Entry: Failed reclaim of $224
* Target 1: $218.00
* Target 2: $215.50
* Stop: Above $224
🟩 Bullish Reversal Setup:
* Entry: Strong reclaim of $224 with volume
* Target 1: $230.00
* Target 2: $234.00
* Stop: Back under $222
🔁 Summary Thoughts
* AMZN flipped from bullish gamma to negative gamma — puts are now driving price action.
* As long as price stays under $224, rallies are sell opportunities.
* Losing $215.50 risks an accelerated drop to $210 or lower.
* Bears remain in control unless buyers step in aggressively at support.
🚨 Disclaimer:
This analysis is for educational purposes only and does not constitute financial advice. Always do your own research and manage your risk accordingly.
🔍 GEX & Options Flow Insight (1st Image Analysis)
AMZN collapsed post-earnings, breaking through major gamma support levels and flipping into a negative gamma environment. Price is now pressing against a critical $215–218 demand zone, with GEX showing heavy put concentration.
* Call Walls & Resistance:
* 📍 $230.00–$234.00 → Former gamma pivot now acting as strong resistance
* 📍 $237.50 → Prior support zone; now a sell wall
* 📍 $244.00 → Highest Positive NET GEX / Gamma Wall (too far for immediate recovery unless momentum shifts)
* Put Walls & Support Zones:
* 🛡️ $222.18 → 2nd Put Wall resistance-turned-support
* 🚨 $218.00 → Current price — key defense line
* 📉 $215.50 → Hard put wall support — losing this could accelerate selloff toward $210
* Volatility Insight:
* IVR 24.4, IVx Avg 50.6 → Elevated IV post-earnings
* Call flow 23.2% → Bearish options flow bias
* GEX sentiment: 🔴🟡🔴 = Negative gamma = higher volatility risk to downside
✅ Option Trading Suggestion:
Bias: Bearish unless AMZN reclaims $224+ Strategy: Bear put spread
* Entry Idea: Buy 220P / Sell 215P for Aug 2 or Aug 9 expiry
* Invalidation: Strong daily close above $224
* Target: $215 → $210
Why this works: Negative gamma positioning means market makers hedge by selling into weakness, accelerating downside moves. The inability to reclaim $224 confirms the bearish structure.
🧠 Technical Analysis (1H Chart) (2nd Image Analysis)
Market Structure & SMC:
* 🟥 CHoCH confirmed after earnings drop
* ❌ Lost all recent BOS levels in one sharp flush
* Price trapped under former OB resistance at $224–230
Trendline Dynamics:
* Broke out of prior bullish channel to the downside
* New descending channel forming with lower highs
SMC Zones:
* 🟩 Demand Zone: $215.50–$218.00 → Immediate defense
* 🟥 Supply Zone (Purple Box): $224–$230 → Sell wall
🔄 Price Action & Key Levels
* Support:
* ✅ $218.00 → Current defense
* ✅ $215.50 → Last line of gamma support
* 🚨 Below $215.50 → Sell momentum can accelerate to $210
* Resistance:
* 🚩 $224.00 → First reclaim needed for relief rally
* 🚩 $230.00–$234.00 → Heavy resistance
🧭 Scalping / Intraday Trade Setup
🟥 Bearish Setup (Preferred):
* Entry: Failed reclaim of $224
* Target 1: $218.00
* Target 2: $215.50
* Stop: Above $224
🟩 Bullish Reversal Setup:
* Entry: Strong reclaim of $224 with volume
* Target 1: $230.00
* Target 2: $234.00
* Stop: Back under $222
🔁 Summary Thoughts
* AMZN flipped from bullish gamma to negative gamma — puts are now driving price action.
* As long as price stays under $224, rallies are sell opportunities.
* Losing $215.50 risks an accelerated drop to $210 or lower.
* Bears remain in control unless buyers step in aggressively at support.
🚨 Disclaimer:
This analysis is for educational purposes only and does not constitute financial advice. Always do your own research and manage your risk accordingly.
Disclaimer
The information and publications are not meant to be, and do not constitute, financial, investment, trading, or other types of advice or recommendations supplied or endorsed by TradingView. Read more in the Terms of Use.
Disclaimer
The information and publications are not meant to be, and do not constitute, financial, investment, trading, or other types of advice or recommendations supplied or endorsed by TradingView. Read more in the Terms of Use.