AMZN: Primed for a Rebound? 🚀 Bullish Signals Emerging!
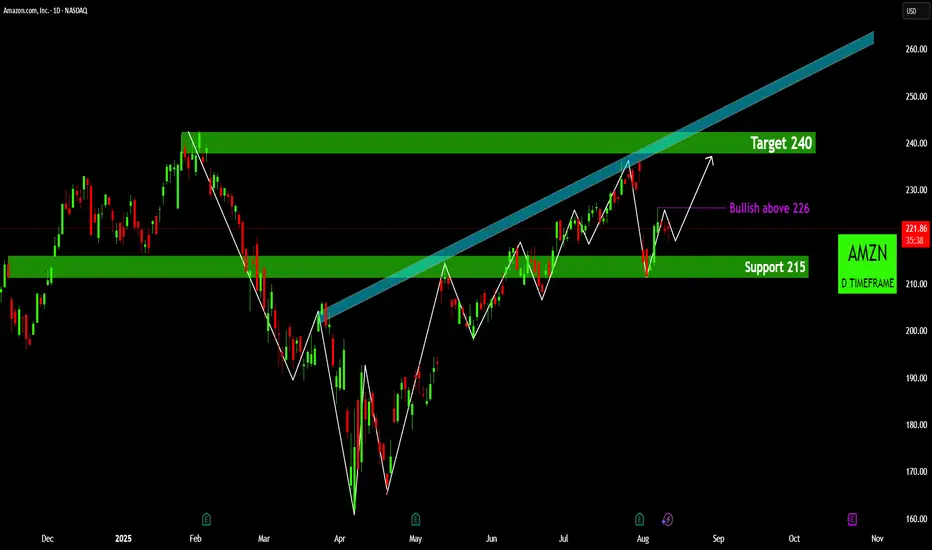
•Pivotal Support Holding Firm: The price has found robust demand around the 215 support zone 🟢, a critical area that has demonstrated its strength in halting previous declines. This level is proving to be a formidable floor, absorbing selling pressure and hinting at buyer conviction.
•Developing Bullish Reversal Pattern: A clear bullish reversal pattern, resembling an inverse head and shoulders or a W-bottom, appears to be unfolding. This formation, characterized by successive higher lows, signals a significant shift from bearish to bullish sentiment.
•Key Bullish Confirmation Point: For an accelerated move higher, a decisive and sustained break above the 226 level ⬆️ is crucial. This price point represents a significant resistance flip, and a push beyond it would likely trigger further buying momentum, confirming the bullish bias.
•Eyes on the Upside Target: Should AMZN successfully break past the 226 confirmation level, the immediate upside target is projected towards the 240 resistance zone 🎯. This area represents a key supply zone from earlier price action, and reaching it would mark a substantial recovery.
Disclaimer:
The information provided in this chart is for educational and informational purposes only and should not be considered as investment advice. Trading and investing involve substantial risk and are not suitable for every investor. You should carefully consider your financial situation and consult with a financial advisor before making any investment decisions. The creator of this chart does not guarantee any specific outcome or profit and is not responsible for any losses incurred as a result of using this information. Past performance is not indicative of future results. Use this information at your own risk. This chart has been created for my own improvement in Trading and Investment Analysis. Please do your own analysis before any investments.
Disclaimer
The information and publications are not meant to be, and do not constitute, financial, investment, trading, or other types of advice or recommendations supplied or endorsed by TradingView. Read more in the Terms of Use.
Disclaimer
The information and publications are not meant to be, and do not constitute, financial, investment, trading, or other types of advice or recommendations supplied or endorsed by TradingView. Read more in the Terms of Use.