Hello?
Dear traders, nice to meet you.
"Like" is a huge force for me.
By "following" you can always get new information quickly.
Thank you for always supporting me.
-------------------------------------------------- -----
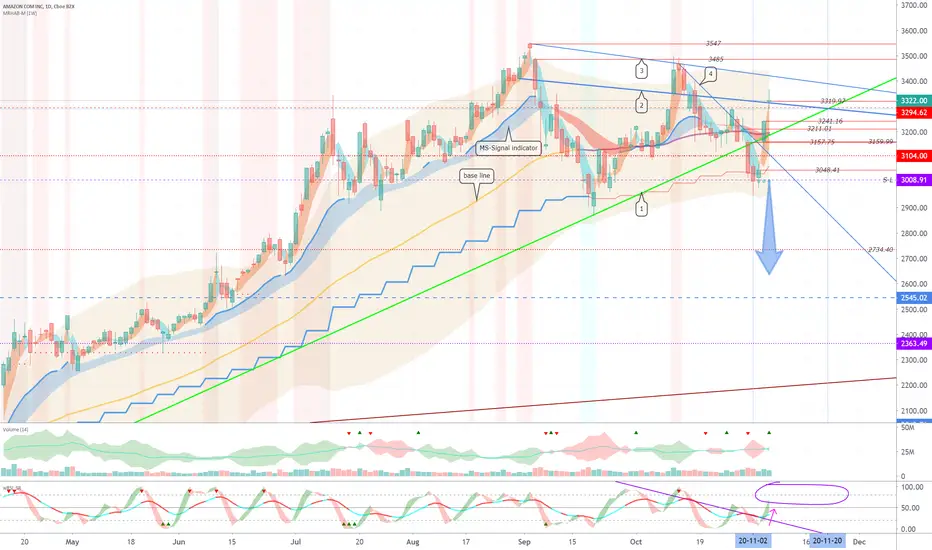
The gap (3241.16-3319.97) started with a rise and ended higher.
We need to see if we'll be revalidating support at the high point of 3294.62.
It remains to be seen if it can rise above the resistance of the uptrend line (2)-(3).
If you fall from the 3294.62 point, you can touch the 3104.0 point, so it is a short stop loss point.
However, there may be a rebound at 3211.01, so we have to see if they support it.
Make sure you are touching the downtrend line (3).
-------------------------------------------------- -----
(DJI 1D chart)

It started with the gap (27847.7-28083.4) rising and closed above the 28256.0 point of the trend turning point.
We need to reaffirm our support at 28256.0 and see if the uptrend continues.
-------------------------------------------------- -------
(IXIC 1D chart)

The gap (11590.8-11816.3) started with a rise and ended higher.
We must see if we can ascend more than 12056.4 points as a move to fill the previous gap.
We should see support at 11695.6 and at the uptrend line (2) and see if it will rise.
-------------------------------------------------- -------------
(SPX 1D chart)

It started with the gap (3443.4-3485.7) higher and ended higher.
It remains to be seen if the rise to fill the previous gap segment of 3580.8-3564.7 continues.
It remains to be seen whether support will be reconfirmed in the high volume profile section, 3455.1-3483.3 section.
-------------------------------------------------- -------------------------------------------
** Check support, resistance, and abbreviation points.
** Support or resistance is based on the closing price of the 1D chart.
** All explanations are for reference only and do not guarantee profit or loss on investment.
Explanation of abbreviations displayed on the chart
R: A point or section of resistance that requires a response to preserve profits
S-L: Stop-Loss point or section
S: A point or segment that can be bought for profit generation as a support point or segment
(Short-term Stop Loss can be said to be a point where profits and losses can be preserved or additionally entered through installment trading. You should trade from a short-term investment perspective.)
GAP refers to the difference in prices that occurred when the stock market, CME and BAKKT exchanges were closed because they do not trade 24 hours a day.
G1: closing price when closed
G2: Market price at the time of opening
Dear traders, nice to meet you.
"Like" is a huge force for me.
By "following" you can always get new information quickly.
Thank you for always supporting me.
-------------------------------------------------- -----
The gap (3241.16-3319.97) started with a rise and ended higher.
We need to see if we'll be revalidating support at the high point of 3294.62.
It remains to be seen if it can rise above the resistance of the uptrend line (2)-(3).
If you fall from the 3294.62 point, you can touch the 3104.0 point, so it is a short stop loss point.
However, there may be a rebound at 3211.01, so we have to see if they support it.
Make sure you are touching the downtrend line (3).
-------------------------------------------------- -----
(DJI 1D chart)
It started with the gap (27847.7-28083.4) rising and closed above the 28256.0 point of the trend turning point.
We need to reaffirm our support at 28256.0 and see if the uptrend continues.
-------------------------------------------------- -------
(IXIC 1D chart)
The gap (11590.8-11816.3) started with a rise and ended higher.
We must see if we can ascend more than 12056.4 points as a move to fill the previous gap.
We should see support at 11695.6 and at the uptrend line (2) and see if it will rise.
-------------------------------------------------- -------------
(SPX 1D chart)
It started with the gap (3443.4-3485.7) higher and ended higher.
It remains to be seen if the rise to fill the previous gap segment of 3580.8-3564.7 continues.
It remains to be seen whether support will be reconfirmed in the high volume profile section, 3455.1-3483.3 section.
-------------------------------------------------- -------------------------------------------
** Check support, resistance, and abbreviation points.
** Support or resistance is based on the closing price of the 1D chart.
** All explanations are for reference only and do not guarantee profit or loss on investment.
Explanation of abbreviations displayed on the chart
R: A point or section of resistance that requires a response to preserve profits
S-L: Stop-Loss point or section
S: A point or segment that can be bought for profit generation as a support point or segment
(Short-term Stop Loss can be said to be a point where profits and losses can be preserved or additionally entered through installment trading. You should trade from a short-term investment perspective.)
GAP refers to the difference in prices that occurred when the stock market, CME and BAKKT exchanges were closed because they do not trade 24 hours a day.
G1: closing price when closed
G2: Market price at the time of opening
Note
(NDAQ 1D chart)The'V' pattern was completed within a short period of time.
We need to make sure we get support at the 131.41 point of volatility around November 11.
Also, we have to see if we can ascend above the 135.11 point.
Since there is a bearish signal in the wRSI_SR indicator, it is highly likely to lead to a decline.
If it gets support at 131.41 when it leads to a downturn, it is expected that there will be further upside opportunities again.
If the uptrend continues, it is expected that there will be further upside opportunities with support at 135.11.
Note
(NFLX 1D chart)The gap (496.95-506.56) started with a rise and ended higher.
By breaking through the volume profile section with an increase in the gap and deviating from the downtrend line (3), expectations for an uptrend are amplified.
We have to see if we can climb above the 525.50 point.
It remains to be seen if volatility around November 10-18 can rise with support at the uptrend line (2).
The trending point should rise above the 539.44 point.
Note
(NIO 1W chart)The gap (37.71-38.78) started with an increase and ended higher.
There is a short-term bearish signal in the wRSI_SR indicator, so careful trading is necessary.
If it falls, we need to see if we can get support at 39.75.
Note
(AAPL 1D chart)The gap (114.95-117.95) started with an increase and ended higher.
Breaking the downtrend line (5)-(4) with a gap upward, amplifying expectations for an uptrend.
We have to see if we can ascend above the 120.96 point.
If it falls, it's important to get support in the resistance section of the downtrend line (5)-(4).
Accordingly, you need to make sure you are getting support above the 115.32 point.
The gap continues to rise, so if it falls from 115.32, it is likely to touch 106.84.
Accordingly, the 115.32 point is the short-term Stop Loss point.
Note
(TWTR 1D chart)The gap (42.76-43.51) started with a rise and ended higher.
You need to make sure you get the support at point 43.67.
In order to turn the trend, it must rise above 45.33.
If it falls, it remains to be seen if it can gain support at 40.97-42.63 and climb along the uptrend line (1).
The wRSI_SR indicator is moving out of the oversold segment.
Accordingly, I think there is a high possibility of a short-term gain.
Note
(FORD (F) 1D chart)It started with the gap (7.63-7.76) rising and ended higher.
Departing from the short-term downtrend line (5), it remains to be seen if it can rise above the critical point of 8.10 points.
We must see if we can climb through the 8.10-8.80 section of the volume profile section.
If you go down from 7.62, you can touch 6.97, so it's a short stop loss point.
Note
(VALE S.A. SPONS ADS REPR 1 COM NPV (VALE) 1W chart)From now on, it will be described only in the name of VALE.
Maintaining the uptrend line (1), it is on a mid to long term uptrend
It is moving along the downtrend line (2), leading to a short-term decline.
It remains to be seen if it can move above the 11.55 point, breaking above the short-term downtrend line (3).
If it is supported at 11.55, it is expected to rise to the 12.47-13.39 transition period.
If it falls from 10.41, it may fall below 9.40, so it is a short stop loss point.
Other content (coins, stocks, etc.) is frequently posted on X.
X에 다른 내용(코인, 주식 등)이 자주 게시.
◆ t.me/readCryptoChannel
[HA-MS Indicator]
bit.ly/3YxHgvN
[OBV Indicator]
bit.ly/4dcyny3
X에 다른 내용(코인, 주식 등)이 자주 게시.
◆ t.me/readCryptoChannel
[HA-MS Indicator]
bit.ly/3YxHgvN
[OBV Indicator]
bit.ly/4dcyny3
Related publications
Disclaimer
The information and publications are not meant to be, and do not constitute, financial, investment, trading, or other types of advice or recommendations supplied or endorsed by TradingView. Read more in the Terms of Use.