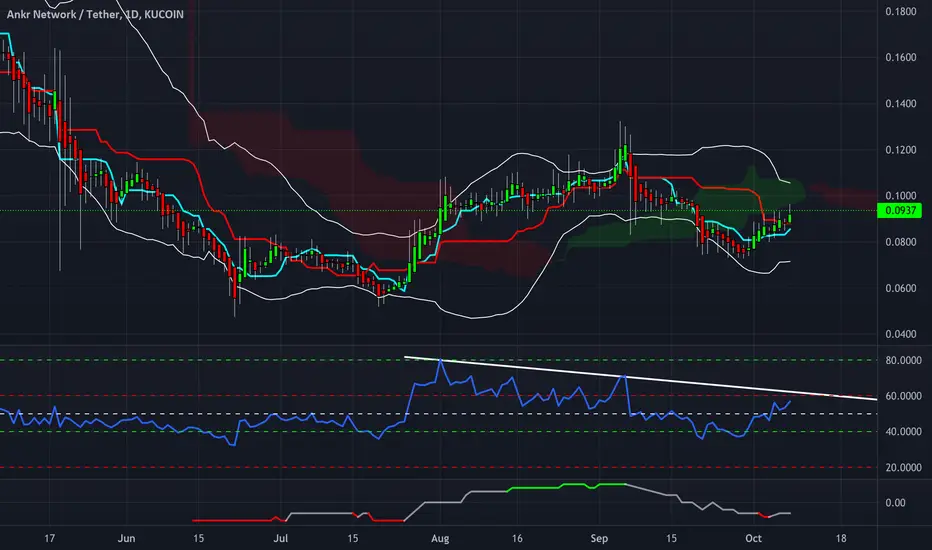
ANKR hasn’t been doing much over the past weeks after taking a big hit back in May. However, it has now broke out on the 4H RSI Chart. As for the Daily chart, below is what is in the cards for ANKR:
1) There is a major resistance at the price $0.11 capped with the RSI & BB.
2) Ichimoku Cloud goes green above $0.11
3) Ichimoku Signal to follow along
4) Expect a violent breakout through $0.11 if ANKR closes a candle above it.
1) There is a major resistance at the price $0.11 capped with the RSI & BB.
2) Ichimoku Cloud goes green above $0.11
3) Ichimoku Signal to follow along
4) Expect a violent breakout through $0.11 if ANKR closes a candle above it.
Unless you figure a way to make money while you sleep, you’ll work till you die.
Disclaimer
The information and publications are not meant to be, and do not constitute, financial, investment, trading, or other types of advice or recommendations supplied or endorsed by TradingView. Read more in the Terms of Use.