---- Mid-term Analysis for the next coming 4 weeks to 3 months - Based on Daily Chart -------
ANKRUSDT: Bullish reversal underway - what next?
Last news : https://crypto.news/binance-labs-invests-in-ankr-a-multi-chain-infrastructure-provider/
Context
- The Global Crypto market leads by BTC and ETH reversed a new bullish trend - ANKR today did a significant acceleration confirming a strong bullish momentum
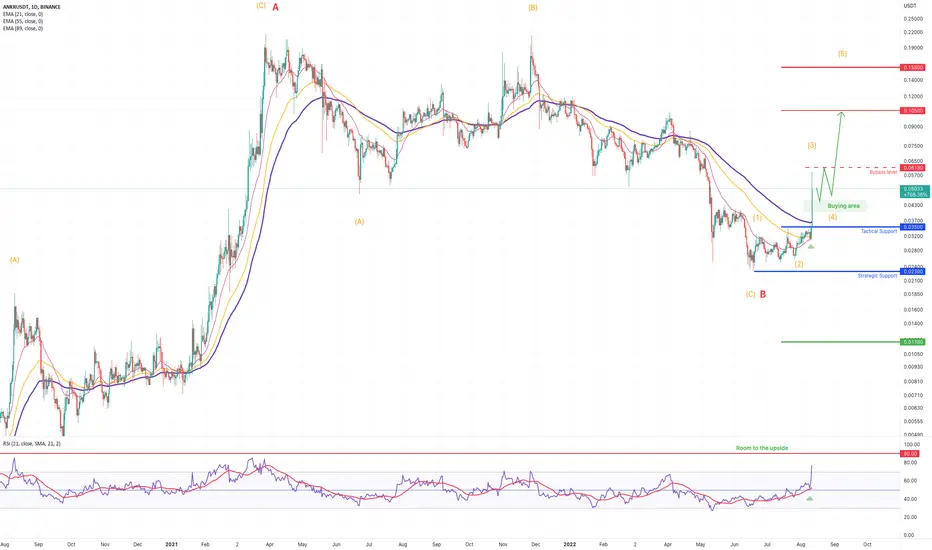
- We are watching at 0,06130 to bypassed to extend the bullish recovery in progress
- Watch 0,035 as key support
Market configuration
- Graphical Elements :
Graphical support = 0,035 &0,023
Graphical Resistance = 0,1050 & 0,01580
- Mathematical Indicators:
EMA ( Exp Moving averages) are support at 0,035 = Bullish
RSI indicator (below) is now above 50% with room to the upside = Bullish
- Elliot & Harmonic Wave (Fibonacci):
A last drop to draw the wave (c) B is now completed - the market is now bouncing off in recovery
Fibonacci resistance of the wave = 0,06130
Fibonacci bullish wave target at 0,1050
Fibonacci bullish wave support at 0,035
Fibonacci bearish wave target at à 0,023
Conclusion
Prefered case => As long as 0,035 remains support a larger recovery towards 0,06130 is expected with strong conviction, only a break above 0,06130 will open a direct recovery potential towards 0,1050 and 0,1580.
Alternative case => Breaking 0,035 a new bearish attack towards the strategic support at 0,023
ANKRUSDT: Bullish reversal underway - what next?
Last news : https://crypto.news/binance-labs-invests-in-ankr-a-multi-chain-infrastructure-provider/
Context
- The Global Crypto market leads by BTC and ETH reversed a new bullish trend - ANKR today did a significant acceleration confirming a strong bullish momentum
- We are watching at 0,06130 to bypassed to extend the bullish recovery in progress
- Watch 0,035 as key support
Market configuration
- Graphical Elements :
Graphical support = 0,035 &0,023
Graphical Resistance = 0,1050 & 0,01580
- Mathematical Indicators:
EMA ( Exp Moving averages) are support at 0,035 = Bullish
RSI indicator (below) is now above 50% with room to the upside = Bullish
- Elliot & Harmonic Wave (Fibonacci):
A last drop to draw the wave (c) B is now completed - the market is now bouncing off in recovery
Fibonacci resistance of the wave = 0,06130
Fibonacci bullish wave target at 0,1050
Fibonacci bullish wave support at 0,035
Fibonacci bearish wave target at à 0,023
Conclusion
Prefered case => As long as 0,035 remains support a larger recovery towards 0,06130 is expected with strong conviction, only a break above 0,06130 will open a direct recovery potential towards 0,1050 and 0,1580.
Alternative case => Breaking 0,035 a new bearish attack towards the strategic support at 0,023
CIO & Head of market research (Automata - Vancelian)
vancelian.com/en
vancelian.com/en
Disclaimer
The information and publications are not meant to be, and do not constitute, financial, investment, trading, or other types of advice or recommendations supplied or endorsed by TradingView. Read more in the Terms of Use.