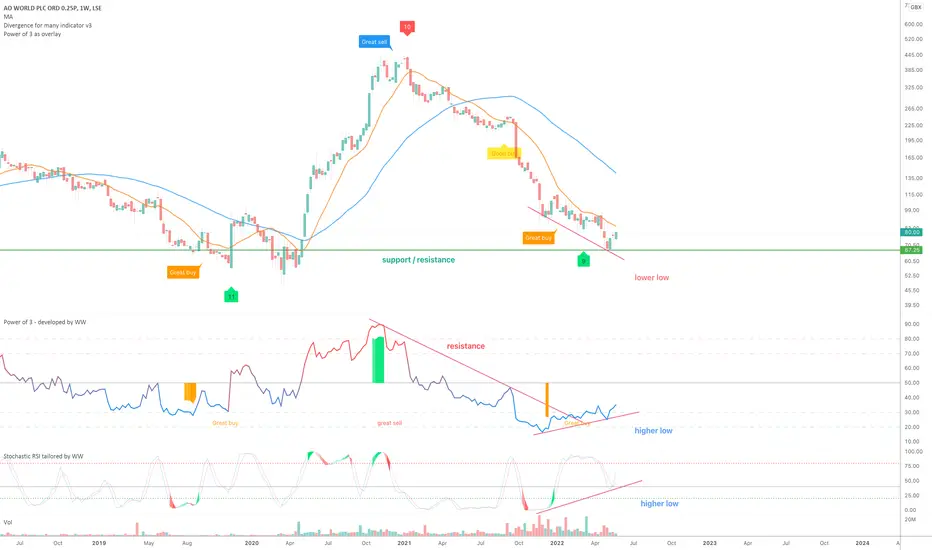
On the above weekly chart price action has corrected a massive 85% since the sell signal back in December 2020. Now everyone is calling for a recession and stock market collapse. We’ll see.
A number of reasons now exist to be bullish, including:
1) A buy signal has printed.
2) Regular bullish divergence. 9 oscillators are currently printing bullish divergence with price action.
3) RSI resistance breakout.
4) Price action finds support on past resistance.
5) Although another month is required to print the current candle as is shown on the 2-month chart below, it is evident price action is finding support on the past resistance channel.
Is it possible price action falls further? For sure.
is it probable? No.
Good luck!
Ww
Type: Investment
Risk: <=6% of portfolio
Duration: N/A
Return: 5x
2-month chart
BTC
bc1q2eckdzh0q8vsd7swcc8et6ze7s99khhxyl7zwy
Weblink: patreon.com/withoutworries
Allow 3-6 months on ideas. Not investment advice. DYOR
bc1q2eckdzh0q8vsd7swcc8et6ze7s99khhxyl7zwy
Weblink: patreon.com/withoutworries
Allow 3-6 months on ideas. Not investment advice. DYOR
Disclaimer
The information and publications are not meant to be, and do not constitute, financial, investment, trading, or other types of advice or recommendations supplied or endorsed by TradingView. Read more in the Terms of Use.