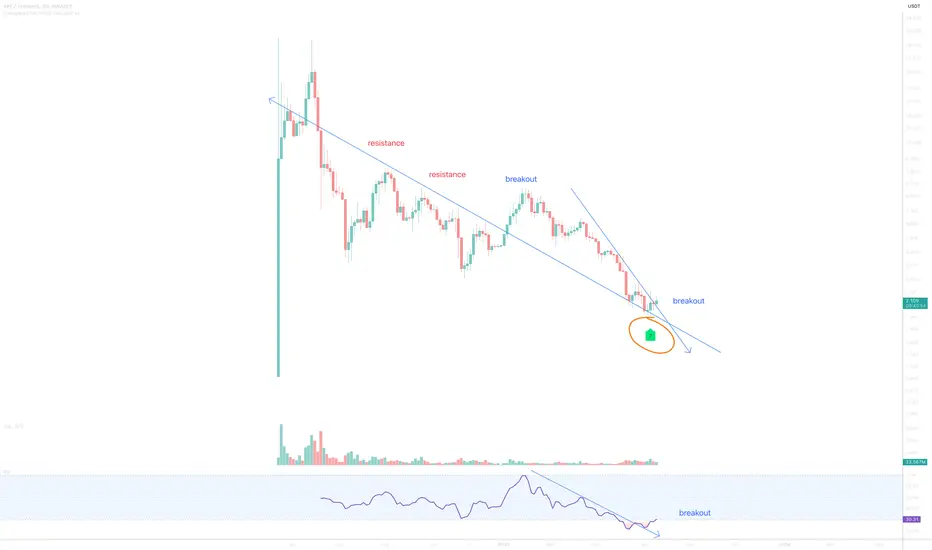
On the above 4-day chart price action has corrected by 90%. Today is great long opportunity. Why?
1) RSI and price action resistance breakout.
2) Multiple oscillators print bullish divergence with price action (orange circle)
3) Price action prints on past resistance since breakout. Look left.
Is it possible price action falls further? Sure.
Is it probable? No.
Ww
Type: trade
Risk: <=6% of portfolio
Timeframe: Now, don’t sit on your hands.
Return: no idea
Trade active
an excellent momentTrade active
resistance breakoutNote
"What do you mean by resistance breakout?" came a question..Daily
Note
Support on past resistance confirms.Trade active
now...Note
Past resistance confirms support.Trade active
Note
nowBTC
bc1q2eckdzh0q8vsd7swcc8et6ze7s99khhxyl7zwy
Weblink: patreon.com/withoutworries
Allow 3-6 months on ideas. Not investment advice. DYOR
bc1q2eckdzh0q8vsd7swcc8et6ze7s99khhxyl7zwy
Weblink: patreon.com/withoutworries
Allow 3-6 months on ideas. Not investment advice. DYOR
Disclaimer
The information and publications are not meant to be, and do not constitute, financial, investment, trading, or other types of advice or recommendations supplied or endorsed by TradingView. Read more in the Terms of Use.
BTC
bc1q2eckdzh0q8vsd7swcc8et6ze7s99khhxyl7zwy
Weblink: patreon.com/withoutworries
Allow 3-6 months on ideas. Not investment advice. DYOR
bc1q2eckdzh0q8vsd7swcc8et6ze7s99khhxyl7zwy
Weblink: patreon.com/withoutworries
Allow 3-6 months on ideas. Not investment advice. DYOR
Disclaimer
The information and publications are not meant to be, and do not constitute, financial, investment, trading, or other types of advice or recommendations supplied or endorsed by TradingView. Read more in the Terms of Use.