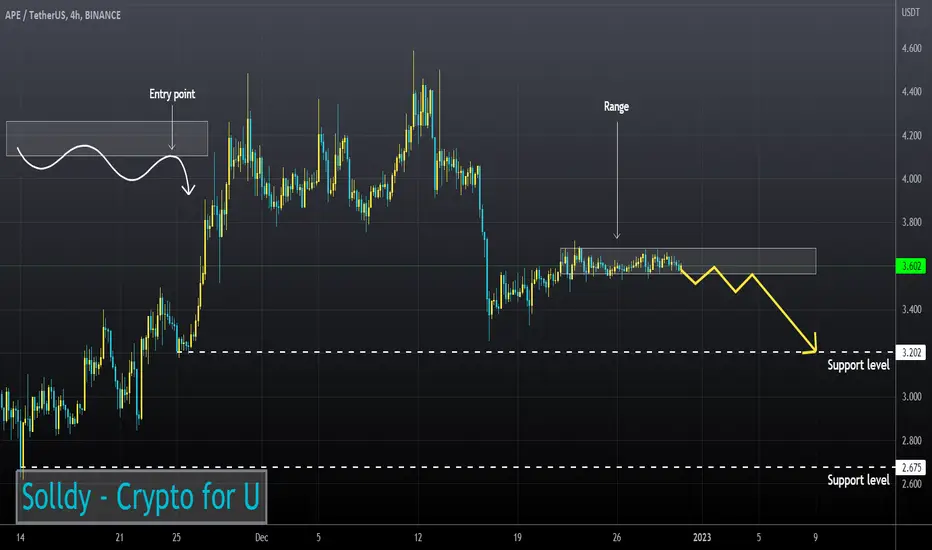
APE is trading near a strong resistance level.
On the 4H TF, price is testing 50EMA as resistance.
The RSI chart is in the sellers zone (4H, 1H and 30m TFs)
50EMA has broken down 200EMA (1H and 30m TFs)
I expect the asset may start to decline after price fixes below the current range.
On the 4H TF, price is testing 50EMA as resistance.
The RSI chart is in the sellers zone (4H, 1H and 30m TFs)
50EMA has broken down 200EMA (1H and 30m TFs)
I expect the asset may start to decline after price fixes below the current range.
Related publications
Disclaimer
The information and publications are not meant to be, and do not constitute, financial, investment, trading, or other types of advice or recommendations supplied or endorsed by TradingView. Read more in the Terms of Use.
Related publications
Disclaimer
The information and publications are not meant to be, and do not constitute, financial, investment, trading, or other types of advice or recommendations supplied or endorsed by TradingView. Read more in the Terms of Use.