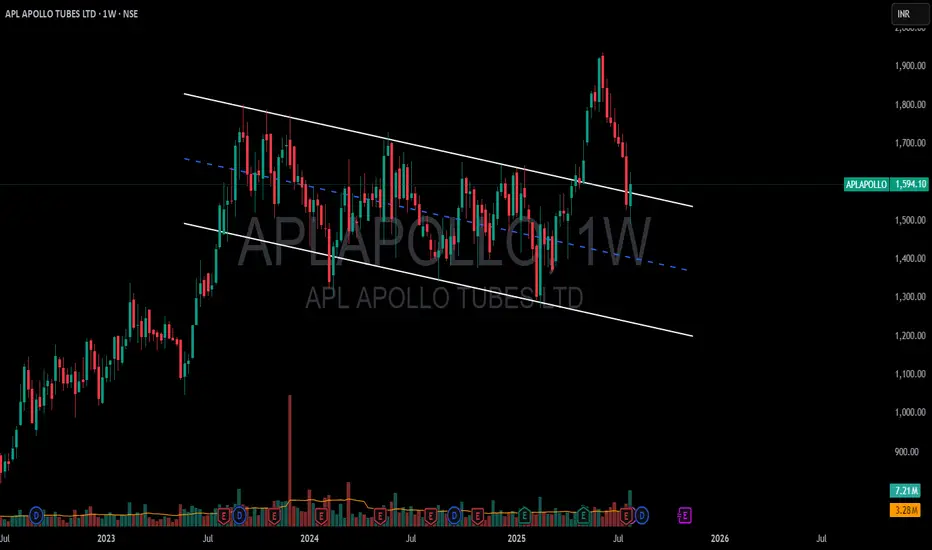
📈 APL Apollo Tubes Ltd. – Bullish Channel Breakout
🔍 Pattern Insight:
Pattern: Bullish Channel (Falling or Rising?) Breakout
(Most likely a falling channel, which is bullish when broken upward)
Current Price: ~₹1594
Breakout Status: ✅ Breakout done
Current Action: 🔁 Retest phase underway
All-Time High (ATH): ₹1,685 (approx as per recent charts)
📊 Technical Setup:
Aspect Details
🔓 Breakout Type Bullish channel (indicates trend reversal or continuation)
🔁 Retest Currently testing breakout zone (bullish if holds ~₹1580–1600)
🔥 Confirmation High volumes + bullish candle near ₹1600
📈 Next Resistance ₹1640 → ₹1685 (ATH)
🧨 Break Above ATH Blue sky breakout; target can go into uncharted territory
🎯 Target Zones After Momentum:
Phase Target
✅ Breakout Sustains ₹1640 (minor supply)
🔼 ATH Challenge ₹1685 (strong resistance)
🚀 Post ATH ₹1750 → ₹1800 (based on Fibonacci or channel projection)
🛡️ Risk Management (Invalidation Levels):
Retest below ₹1575–1560 with strong red candle and volume = ⚠️ weak setup
Better to keep a stop-loss below ₹1550 if swing trading
📅 Strategy Suggestion:
🧪 If you're planning an entry:
✅ Entry Zone: ₹1590–1600 (post confirmation of support)
🛑 Stop-loss: ₹1548 (safely below breakout zone)
🎯 Targets:
1st: ₹1640
2nd: ₹1685
3rd (if ATH breaks): ₹1750+
📌 Summary:
APL Apollo has shown a bullish channel breakout ✅
Retest in progress → if buyers defend ~₹1580–1600 zone with volume, uptrend may resume
Potential to break ATH of ₹1685 if momentum continues
Watch volume and Nifty Metal Index for broader confirmation
Disclaimer: The information provided is for educational and informational purposes only and should not be considered as financial advice. Investing in the stock market involves risk, and past performance is not indicative of future results. Please consult with a certified financial advisor or conduct your own research before making any investment decisions. We are not responsible for any losses incurred as a result of using this information. Stock market investments are subject to market risks; read all related documents carefully.
Disclaimer
The information and publications are not meant to be, and do not constitute, financial, investment, trading, or other types of advice or recommendations supplied or endorsed by TradingView. Read more in the Terms of Use.
Disclaimer
The information and publications are not meant to be, and do not constitute, financial, investment, trading, or other types of advice or recommendations supplied or endorsed by TradingView. Read more in the Terms of Use.