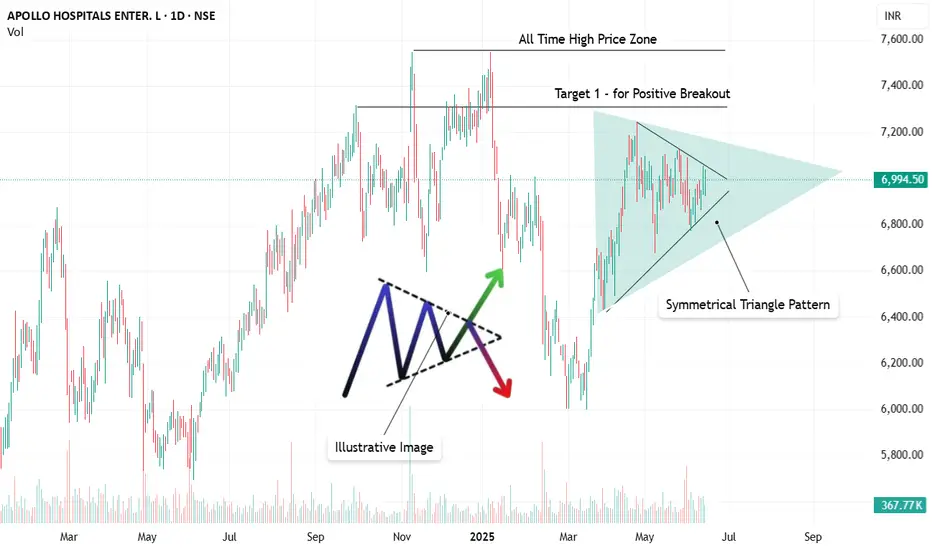
Apollo Hospitals (APOLLOHOSP) is currently forming a well-defined Symmetrical Triangle pattern on the daily chart.
Key Observations:
• Symmetrical Triangle: Price action has been consolidating within converging trendlines,
indicating indecision between buyers and sellers.
• Potential Breakout: A breakout above the upper trendline of the triangle, coupled with
increased volume, would signal a bullish continuation.
• Target 1 (Post-Breakout): The chart indicates a "Target 1 - for Positive Breakout" around
the 7300-7350 zone, which aligns with previous resistance levels.
• All-Time High Price Zone: The stock previously reached an "All Time High Price Zone"
around 7500-7600, which could be a further upside target if the bullish momentum
sustains.
Trading Idea:
• Entry: Look for a sustained breakout above the upper trendline of the symmetrical triangle. Confirm with strong volume.
• Target 1: 7300 - 7350 (Based on previous resistance and indicated target).
• Stop Loss: A break below the lower trendline of the symmetrical triangle would
invalidate the bullish setup. Traders can place stop-loss orders below a recent swing low
within the triangle or slightly below the lower trendline post-breakout confirmation.
Risk Management:
• Always use appropriate risk management and position sizing.
• Monitor volume closely during the breakout attempt.
Disclaimer: This is for educational purposes only and not financial advice. Do your own research before making any trading decisions.
Disclaimer
The information and publications are not meant to be, and do not constitute, financial, investment, trading, or other types of advice or recommendations supplied or endorsed by TradingView. Read more in the Terms of Use.
Disclaimer
The information and publications are not meant to be, and do not constitute, financial, investment, trading, or other types of advice or recommendations supplied or endorsed by TradingView. Read more in the Terms of Use.