Technical Overview
Apollo Tyers has shown a strong structural uptrend over the past few years. Using Elliott Wave Theory, the stock appears to be completing a classic 5-wave impulse pattern on the weekly chart.
Elliott Wave Count Breakdown
Key Observations
✅ The price took strong support at the 200 EMA on the weekly chart — a crucial indicator used by institutional traders to gauge long-term trend strength.
🔄 The ongoing correction seems to be complex (likely WXY or triangle-based) rather than a simple ABC.
📐 Fibonacci levels suggest the next leg higher (Wave 5) could target the ₹650 zone, with further potential beyond if momentum sustains.
Strategy Insights
If the corrective Wave (4) is indeed near completion: APOLLOTYRE
Investors may look for confirmation via a breakout above recent consolidation highs.
Traders can wait for trend confirmation with volume and price action before entry.
Stop-loss could be managed below the 200 EMA or below the recent swing low of the corrective move.
Apollo Tyers has shown a strong structural uptrend over the past few years. Using Elliott Wave Theory, the stock appears to be completing a classic 5-wave impulse pattern on the weekly chart.
Elliott Wave Count Breakdown
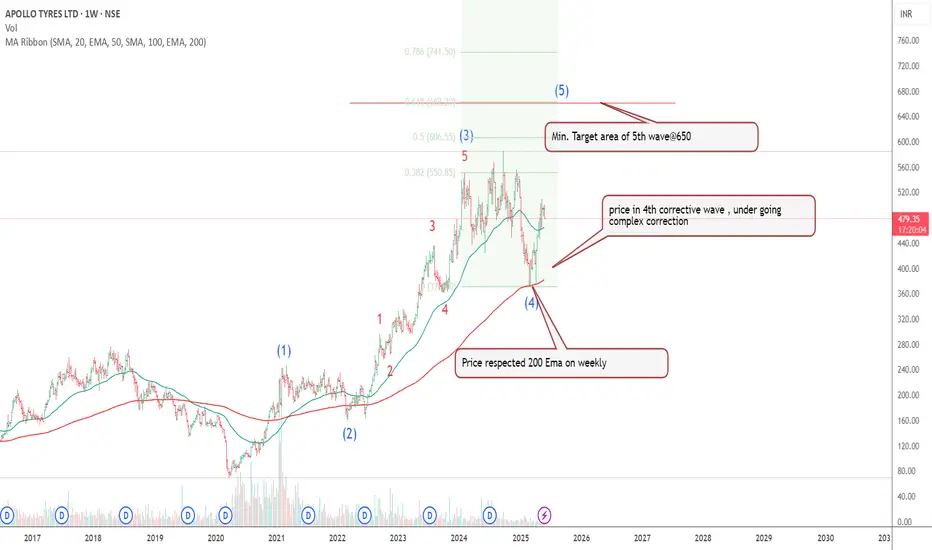
- Wave (1) to (3): A clear and powerful uptrend, supported by increasing volume and price acceleration.
- Wave (4): Currently in progress – the stock is undergoing a complex corrective structure, often seen in Wave 4 phases.
- Wave (5): Yet to unfold. Based on Fibonacci projections, the minimum target for Wave 5 is ₹650.
Key Observations
✅ The price took strong support at the 200 EMA on the weekly chart — a crucial indicator used by institutional traders to gauge long-term trend strength.
🔄 The ongoing correction seems to be complex (likely WXY or triangle-based) rather than a simple ABC.
📐 Fibonacci levels suggest the next leg higher (Wave 5) could target the ₹650 zone, with further potential beyond if momentum sustains.
Strategy Insights
If the corrective Wave (4) is indeed near completion:
Investors may look for confirmation via a breakout above recent consolidation highs.
Traders can wait for trend confirmation with volume and price action before entry.
Stop-loss could be managed below the 200 EMA or below the recent swing low of the corrective move.
Disclaimer
The information and publications are not meant to be, and do not constitute, financial, investment, trading, or other types of advice or recommendations supplied or endorsed by TradingView. Read more in the Terms of Use.
Disclaimer
The information and publications are not meant to be, and do not constitute, financial, investment, trading, or other types of advice or recommendations supplied or endorsed by TradingView. Read more in the Terms of Use.