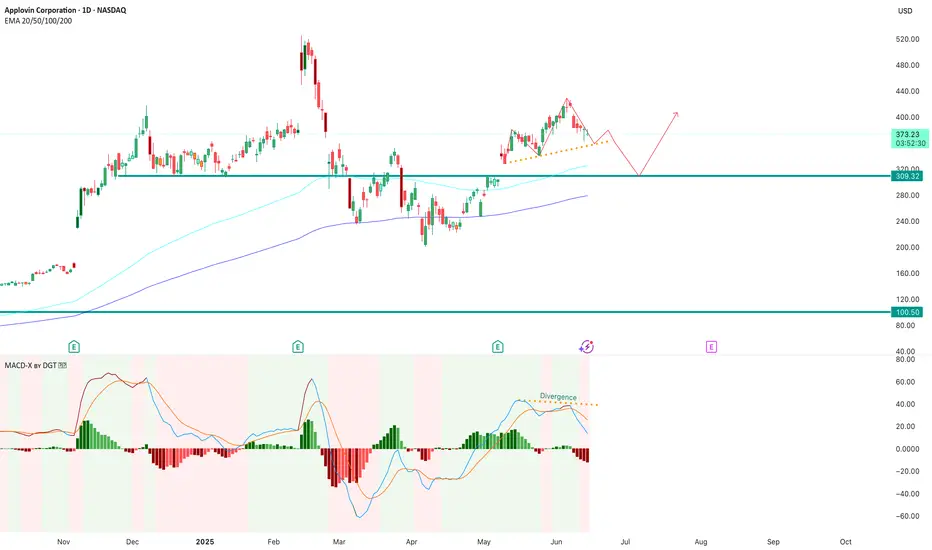
🟢 Head and Shoulders Pattern (Bearish)
* The price action is forming a left shoulder, a higher peak (head), and a right shoulder.
* This classical pattern often signals a reversal from bullish to bearish.
* The dotted orange neckline marks the potential support – if broken, it could trigger a sharper decline.
📉 Key Technical Zones
* Neckline Support: Around $309. A breakdown below this level may confirm the pattern.
* Previous Support: In case of a breakdown, next strong support lies near $100–110 (long-term zone).
* Upside Scenario: If neckline holds and bullish momentum resumes, the pattern could be invalidated with a breakout over $400.
📊 MACD Divergence
* MACD shows a bearish divergence (higher price highs vs. lower MACD highs), signaling momentum weakness.
* The histogram is turning red again – a bearish sign.
* A bearish crossover has already occurred, supporting a possible downtrend.
🔄 Possible Scenarios
* Bearish: If neckline breaks → possible drop toward the $200s or lower.
* Neutral: Consolidation between $310–$380.
* Bullish: If price bounces before neckline and breaks above $400 → invalidates pattern.
Disclaimer
The information and publications are not meant to be, and do not constitute, financial, investment, trading, or other types of advice or recommendations supplied or endorsed by TradingView. Read more in the Terms of Use.
Disclaimer
The information and publications are not meant to be, and do not constitute, financial, investment, trading, or other types of advice or recommendations supplied or endorsed by TradingView. Read more in the Terms of Use.