Long
#APPC experimental complex chart
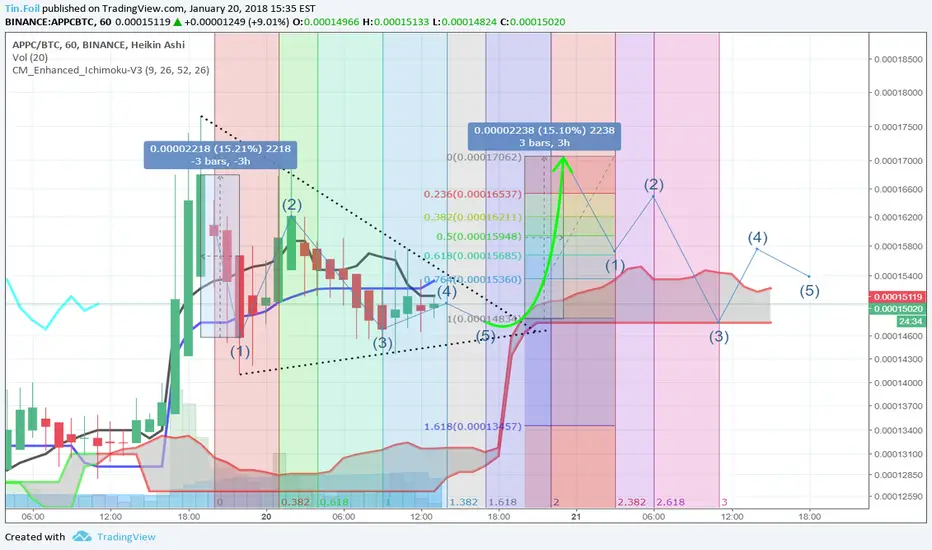
Just an experimental chart utilizing fib time to predict highs and lows within each time period and then fib retracement as well as ichimoku to predict possible high and low levels. This is an extended 1 hour chart that may be blown by if APPC takes off as the markets begin to rally.
I decided to do this chart as an experiment because the current formation of APPC is one that is difficult to predict. It's almost a bullish flag but the bullish flag is as big, or bigger than the flag pole itself, so it's more of a triangle alone.
I don't know much about elliot waves, other than the third wave is usually the longest. So based on the prior waves, I tried to predict the next waves using the combination of fib time/retracement and ichimoku combined.
I don't think I'll be very accurate here, but it's worth taking a shot.
Note
Well, that was an almost instant failure. None of that worked, other than Ichimoku approaching the shoulder and being pressed up. We broke from the triangle, so lets see if we get 15% or higher gains here:Related publications
Disclaimer
The information and publications are not meant to be, and do not constitute, financial, investment, trading, or other types of advice or recommendations supplied or endorsed by TradingView. Read more in the Terms of Use.
Related publications
Disclaimer
The information and publications are not meant to be, and do not constitute, financial, investment, trading, or other types of advice or recommendations supplied or endorsed by TradingView. Read more in the Terms of Use.