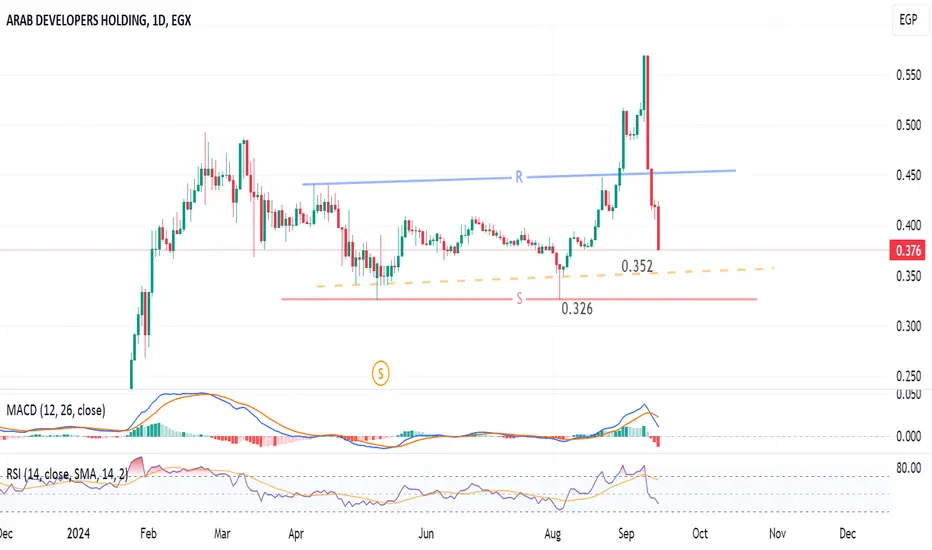
Daily chart, the stock  ARAB has been falling badly. The pattern is showing a possibility for 2 rebound levels: 0.352 and 0.326
Technical indicators:
RSI is near a BUY zone.
MACD is signalling a down movement.
So, a new entry should be after the clear rebound.
Be careful with this stock!
Technical indicators:
RSI is near a BUY zone.
MACD is signalling a down movement.
So, a new entry should be after the clear rebound.
Be careful with this stock!
Disclaimer
The information and publications are not meant to be, and do not constitute, financial, investment, trading, or other types of advice or recommendations supplied or endorsed by TradingView. Read more in the Terms of Use.
Disclaimer
The information and publications are not meant to be, and do not constitute, financial, investment, trading, or other types of advice or recommendations supplied or endorsed by TradingView. Read more in the Terms of Use.