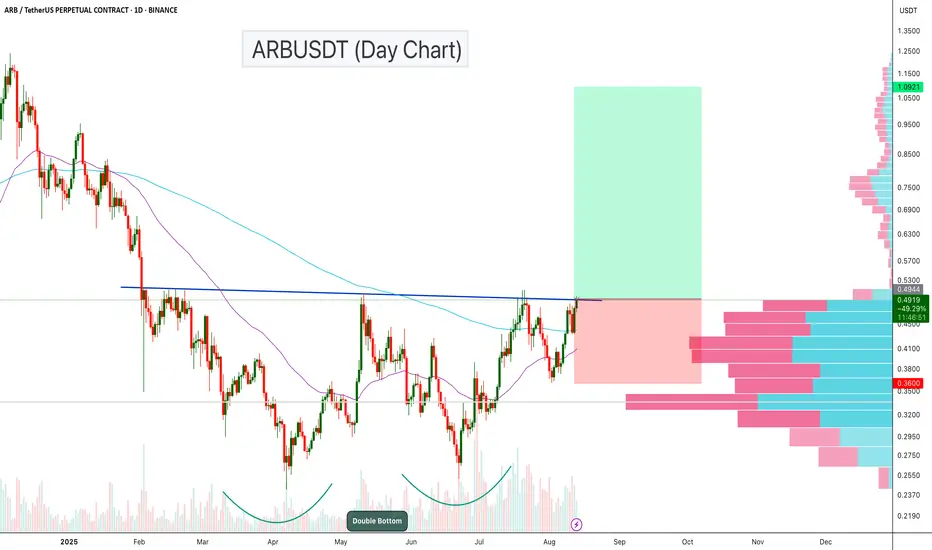
ARBUSDT is showing a strong bullish structure on the daily chart, with a classic Double Bottom pattern forming over the past few months. Price is now pressing against the neckline resistance, which, if broken, could trigger a powerful upside move.
Key Points:
Double Bottom Formation: The pattern started in April 2025 and completed its second bottom in July, indicating a potential long-term reversal setup.
Neckline Resistance: Price is currently testing the $0.49–$0.50 zone, which aligns with previous swing highs and marks the breakout level for the pattern.
Volume Profile: The visible range volume profile shows low-volume nodes above $0.50, suggesting a potential “thin air” move toward higher targets if the breakout is confirmed.
The chart is setting up for a potential trend reversal. A confirmed breakout from the double bottom neckline could propel ARBUSDT toward the $1+ zone
Cheers
Hexa
🚀Telegram : t.me/hexatrades
🌐Website: hexatrades.io/
🗣️Twitter(X): twitter.com/HexaTrades
🌐Website: hexatrades.io/
🗣️Twitter(X): twitter.com/HexaTrades
Related publications
Disclaimer
The information and publications are not meant to be, and do not constitute, financial, investment, trading, or other types of advice or recommendations supplied or endorsed by TradingView. Read more in the Terms of Use.