Hello
I want to make it simpler for those traders who are not sure about this symbol.
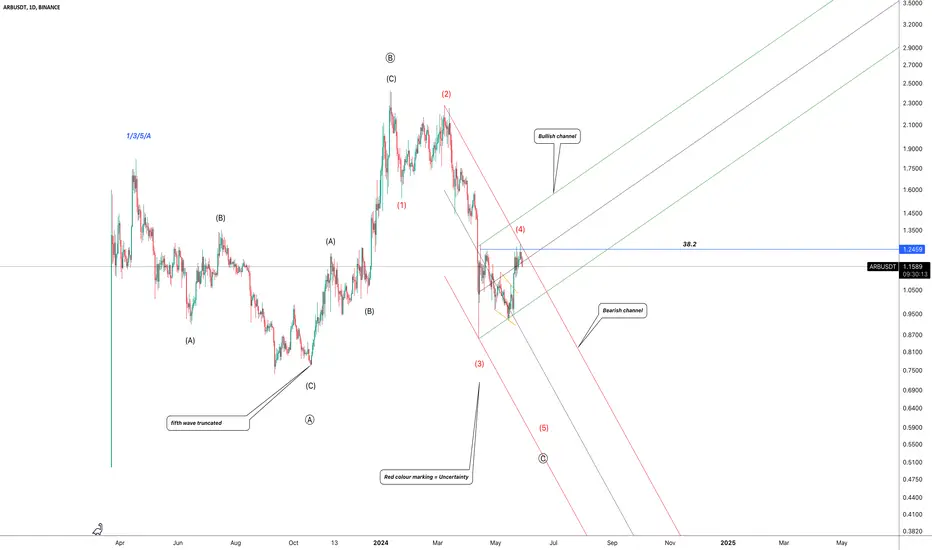
If ARB drops down along side this red boundaries, we can see last bearish fifth wave , but if ARB wants to reverse, so it should break out green channel with strong movements.
Just sit and see for now
Thanks
I want to make it simpler for those traders who are not sure about this symbol.
If ARB drops down along side this red boundaries, we can see last bearish fifth wave , but if ARB wants to reverse, so it should break out green channel with strong movements.
Just sit and see for now
Thanks
Note
Everything depends on our blue 38.2 Fibo level( static resistance ) with 1.2459 USD price.Note
How deep will wave (5) correct, you think?Disclaimer
The information and publications are not meant to be, and do not constitute, financial, investment, trading, or other types of advice or recommendations supplied or endorsed by TradingView. Read more in the Terms of Use.
Disclaimer
The information and publications are not meant to be, and do not constitute, financial, investment, trading, or other types of advice or recommendations supplied or endorsed by TradingView. Read more in the Terms of Use.