1. Downtrend Line:
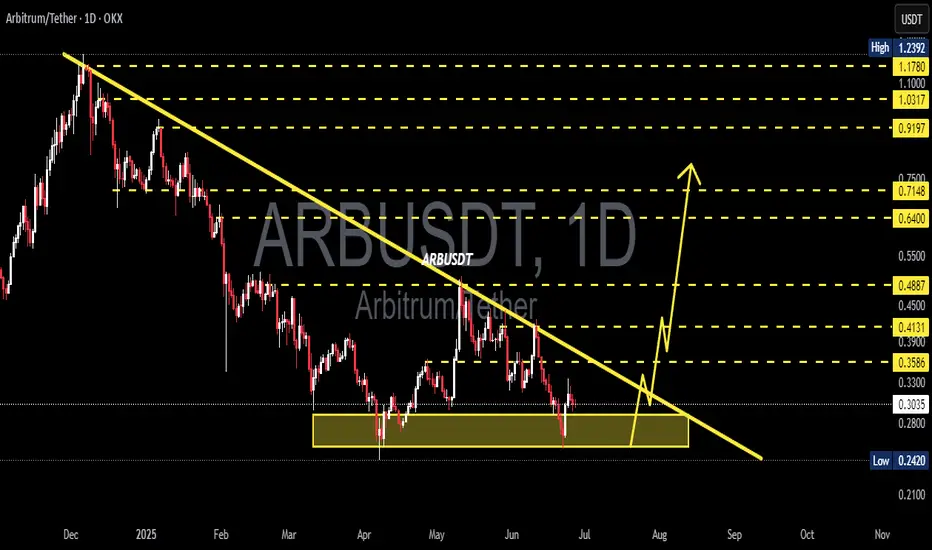
ARB has been in a sustained downtrend since late 2024, marked by a descending trendline from previous highs. The current price is testing this resistance line, hinting at a possible breakout.
2. Strong Support Zone (Demand Area):
A clear accumulation zone is observed between $0.28–$0.30, where the price has consistently bounced back. This indicates solid buying pressure and strong investor interest at this level.
3. Potential Breakout Signal:
The price is now compressing near the end of the descending triangle and is forming higher lows, suggesting a breakout setup is forming.
4. Projected Price Targets (If Breakout Confirmed):
Upon successful breakout and retest confirmation, ARB may rally toward the following resistance levels:
$0.3586
$0.3930
$0.4131
$0.4887
$0.6400
Ultimate targets could reach as high as $0.7148–$0.9197, depending on market momentum.
5. Risk & Invalidations:
A failure to hold the $0.28–$0.30 support zone and a breakdown below may invalidate the bullish structure, potentially retesting the low near $0.2420.
Conclusion:
This chart presents a high-potential breakout opportunity for ARB/USDT. Strong accumulation at key support, along with building pressure against the descending trendline, suggests a significant reversal could be underway. A great setup for swing traders and medium-term investors to monitor closely.
✅ Get Free Signals! Join Our Telegram Channel Here: t.me/TheCryptoNuclear
✅ Twitter: twitter.com/crypto_nuclear
✅ Join Bybit : partner.bybit.com/b/nuclearvip
✅ Benefits : Lifetime Trading Fee Discount -50%
✅ Twitter: twitter.com/crypto_nuclear
✅ Join Bybit : partner.bybit.com/b/nuclearvip
✅ Benefits : Lifetime Trading Fee Discount -50%
Disclaimer
The information and publications are not meant to be, and do not constitute, financial, investment, trading, or other types of advice or recommendations supplied or endorsed by TradingView. Read more in the Terms of Use.