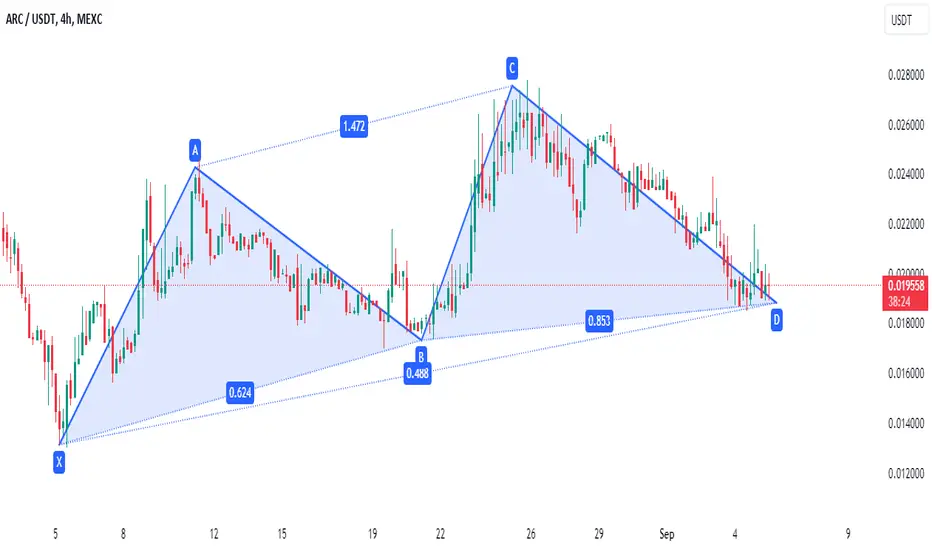
$NYSE:ARC chart shows a clear harmonic pattern with a potential bullish reversal at point D, following a textbook AB=CD pattern. The price completed its harmonic wave structure, with support formed near the 0.018 level. If the support holds, we could see a strong upward move toward the next resistance level at 0.024. The completion of this pattern on ARC signals a good buying opportunity for traders looking for a rebound, but confirmation is essential to avoid false breakouts. The 0.0195 level acts as a key pivot point.
Disclaimer
The information and publications are not meant to be, and do not constitute, financial, investment, trading, or other types of advice or recommendations supplied or endorsed by TradingView. Read more in the Terms of Use.
Disclaimer
The information and publications are not meant to be, and do not constitute, financial, investment, trading, or other types of advice or recommendations supplied or endorsed by TradingView. Read more in the Terms of Use.