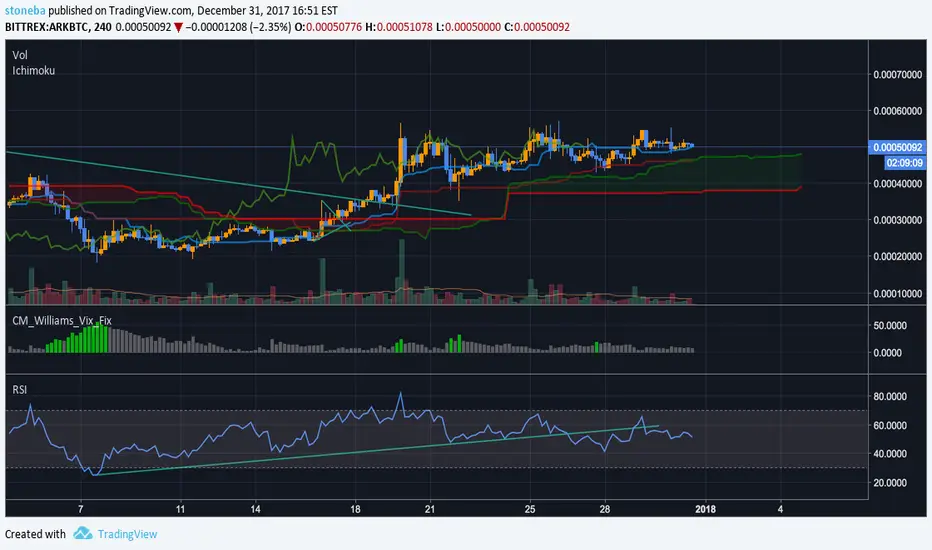
I'm seeing a similar pattern on a lot of my favorite alts. Hidden bullish divergence (RSI lower lows, price action higher highs), Ichimoku cloud flip, and with ARK in particular we may see an end-to-end cloud break on the daily time frame. Ark is in a clearly defined ascending triangle. I don't think this is bearish enough to be a triple top; the bulls are likely testing the resistance to break upward. The upper limit of the Ichimoku cloud fits perfectly onto the 50% retracement zone of a Fibonacci from the All-time high back in September.
1st target: 0.00070995
babypips.com/learn/forex/divergence-cheat-sheet
1st target: 0.00070995
babypips.com/learn/forex/divergence-cheat-sheet
Note
Ascending triangle breakout to the upside :DTrade active
Trade active
Trade closed: target reached
Disclaimer
The information and publications are not meant to be, and do not constitute, financial, investment, trading, or other types of advice or recommendations supplied or endorsed by TradingView. Read more in the Terms of Use.
Disclaimer
The information and publications are not meant to be, and do not constitute, financial, investment, trading, or other types of advice or recommendations supplied or endorsed by TradingView. Read more in the Terms of Use.