Detailed Analysis:
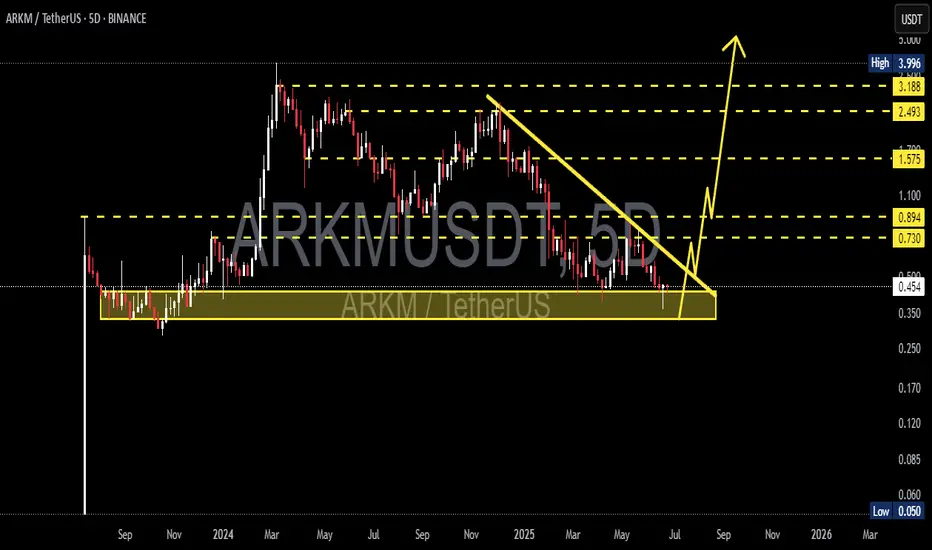
ARKM/USDT is currently showing a strong technical signal for a potential bullish reversal after a prolonged downtrend from its peak near $3.996. Here are the key insights from the chart:
1. Long-Term Accumulation Zone:
Price has formed a strong horizontal support zone between $0.35 and $0.45 (highlighted in yellow).
Multiple rejections from this zone indicate accumulation by smart money.
2. Descending Triangle Breakout Pattern:
A clear downward trendline has been tested multiple times and is now close to being broken.
A successful breakout could trigger a powerful upward rally.
3. Potential Upside Targets (Resistance Levels):
Target 1: $0.73
Target 2: $0.894
Target 3: $1.575
Target 4: $2.493
Target 5: $3.188
Final Target (ATH): $3.996
4. Potential Trading Strategy:
Aggressive entry: On breakout above the descending trendline with strong volume.
Conservative entry: On retest of the broken trendline, now acting as support.
Stop-loss: Just below the accumulation zone (~$0.30).
5. Market Sentiment:
The market structure suggests a potential bullish reversal is building.
If momentum confirms, this setup has significant upside potential.
🎯 Summary:
ARKM is showing signs of strength as it approaches a breakout from a key descending triangle pattern. A move above the resistance could mark the beginning of a strong bullish trend. Keep an eye on volume and breakout confirmation.
#ARKM #ARKMUSDT #CryptoBreakout #AltcoinAnalysis #TechnicalAnalysis #CryptoReversal #BullishSetup #CryptoTrading #TradingView #DescendingTriangle
✅ Get Free Signals! Join Our Telegram Channel Here: t.me/TheCryptoNuclear
✅ Twitter: twitter.com/crypto_nuclear
✅ Join Bybit : partner.bybit.com/b/nuclearvip
✅ Benefits : Lifetime Trading Fee Discount -50%
✅ Twitter: twitter.com/crypto_nuclear
✅ Join Bybit : partner.bybit.com/b/nuclearvip
✅ Benefits : Lifetime Trading Fee Discount -50%
Disclaimer
The information and publications are not meant to be, and do not constitute, financial, investment, trading, or other types of advice or recommendations supplied or endorsed by TradingView. Read more in the Terms of Use.