Let's analyze the ARK Autonomous Technology & Robotics ETF (ARKQ) with a focus on a "giant cup and handle" pattern and the MACD (8,13).
As of Friday, June 27, 2025, at 10:26:18 PM PDT, here's a breakdown of ARKQ:
**Current Price & Performance:**
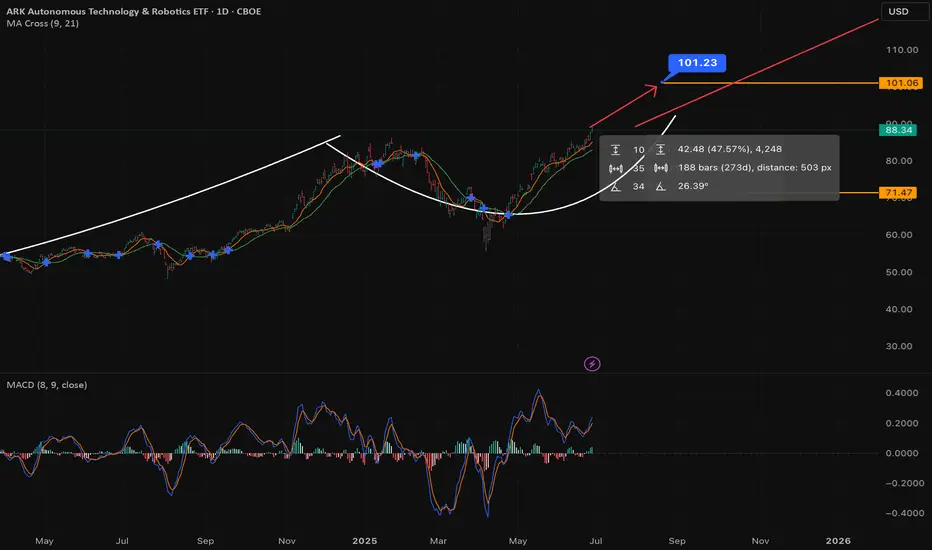
* **Last Price:** $88.34 (as of 4:00 PM ET on June 27, 2025)
* **Today's Change:** Up $0.55 (0.63%)
* **Previous Close:** $87.79
* **Today's Range:** $87.59 - $89.15
* **52-Week Range:** $48.25 - $89.15 (Today's high is the 52-week high for ARKQ, indicating a strong recent upward movement.)
---
### **Giant Cup and Handle Forming**
A "Cup and Handle" is a bullish continuation pattern that typically forms over several months to over a year, making a "giant" one a long-term pattern.
* **The "Cup":** A "U" shaped formation where the price declines, bottoms out, and then rises back to approximately the original level. The ideal cup has a smooth, rounded bottom (not a sharp "V").
* **The "Handle":** A smaller, shorter consolidation pattern that forms on the right side of the cup, typically with a slight downward drift, often resembling a flag or pennant. It should generally form in the top half of the cup.
* **Breakout:** A decisive move above the resistance level created by the top of the cup and handle, on increased volume, confirms the pattern.
**ARKQ and the Giant Cup and Handle:**
ARKQ, like many growth and tech-focused ETFs, experienced a significant bull run into late 2021/early 2022, followed by a substantial pullback throughout 2022. It then began a recovery phase in late 2022/early 2023.
* **The "Cup":** This pattern would likely be formed by ARKQ's peak in late 2021/early 2022 (around $90-$100), the subsequent decline through 2022 to its lows (around $30-$40), and the long, sustained recovery back towards its previous highs. This entire multi-year U-shaped recovery would constitute the "giant cup." Its recent move to a 52-week high of $89.15 suggests it has almost completed the right side of this cup, nearing the "rim" or previous high.
* **The "Handle":** The "handle" would be a more recent, shorter consolidation that forms as ARKQ approaches that previous high. If ARKQ has been consolidating sideways or with a slight downward drift in the last few weeks or months (e.g., after hitting highs in the $80s and pulling back slightly before pushing higher again today), that could be the "handle" in formation.
**Confirmation:**
For this "giant cup and handle" to be confirmed, ARKQ would need to:
1. **Clearly form a handle:** A distinct period of consolidation (a few weeks to a few months) following the completion of the cup's right side, typically with decreasing volume.
2. **Breakout:** A decisive move above the "rim" of the cup (the previous high, which is also the 52-week high of $89.15, or even higher, if considering a very long-term cup from earlier all-time highs), on strong, increasing volume.
**Significance:** A giant cup and handle, when confirmed, is a powerful bullish continuation pattern. The price target is typically measured by the depth of the cup projected upwards from the breakout point. Given the depth of ARKQ's potential cup (from highs around $90-$100 to lows around $30-$40), the projected upside could be substantial, potentially indicating new all-time highs well beyond its current range.
---
### **MACD (Moving Average Convergence Divergence) (8,13)**
You've requested custom MACD settings (8,13). This makes the indicator more sensitive to recent price movements compared to the standard (12,26) settings.
* **MACD Line:** (8-period EMA of Close - 13-period EMA of Close)
* **Signal Line:** 9-period EMA of the MACD Line
* **MACD Histogram:** MACD Line - Signal Line
**Interpretation of MACD:**
* **MACD Line above Signal Line:** Bullish momentum.
* **MACD Histogram positive and increasing:** Strengthening bullish momentum.
* **MACD Line below Signal Line:** Bearish momentum.
* **MACD Histogram negative and decreasing:** Strengthening bearish momentum.
**Current ARKQ MACD (8,13) State:**
ARKQ has recently reached a new 52-week high, indicative of strong upward momentum.
* It's highly probable that the **MACD Line (8,13) is currently above its Signal Line**. This indicates **bullish momentum**.
* The **MACD Histogram is likely positive**, and given today's slight gain to a new 52-week high, it might still be increasing or holding strong, showing sustained buying pressure.
**Confluence:**
A strong, positive MACD (8,13) would provide bullish confirmation for the potential cup and handle pattern. If the MACD maintains its bullish stance as the handle forms (perhaps showing a slight cooling during the handle's drift but staying positive), and then accelerates again on a breakout, it would be a very strong signal.
---
### **Overall Outlook for ARKQ:**
ARKQ is showing compelling technical formations.
* The **"giant cup and handle" pattern** appears to be in an advanced stage, with the ETF having completed much of the "cup" by nearing its previous multi-year highs. The formation of the "handle" now becomes critical. If it forms constructively and leads to a breakout, it signals a significant bullish continuation with substantial upside potential.
* The **MACD (8,13)** is likely confirming the recent bullish momentum, with the MACD line above its signal line and a positive histogram. This supports the idea that buying pressure remains strong.
**Considerations:**
* **ETF Holdings:** ARKQ is an actively managed ETF. Its performance is tied to the performance of its underlying holdings in autonomous technology and robotics. Understanding the outlook for these sectors is crucial.
* **Volume:** As with any chart pattern, volume confirmation is key. Strong volume on a breakout from the "handle" would lend significant credibility to the pattern.
* **Risk:** While the cup and handle is bullish, no pattern is guaranteed. Monitor for potential failures of the pattern (e.g., breakdown below the handle's support).
This analysis is based on your provided pattern and indicator, combined with current market data. It is not financial advice. Always conduct your own thorough fundamental and technical research and consult with a qualified financial advisor before making any investment decisions.
As of Friday, June 27, 2025, at 10:26:18 PM PDT, here's a breakdown of ARKQ:
**Current Price & Performance:**
* **Last Price:** $88.34 (as of 4:00 PM ET on June 27, 2025)
* **Today's Change:** Up $0.55 (0.63%)
* **Previous Close:** $87.79
* **Today's Range:** $87.59 - $89.15
* **52-Week Range:** $48.25 - $89.15 (Today's high is the 52-week high for ARKQ, indicating a strong recent upward movement.)
---
### **Giant Cup and Handle Forming**
A "Cup and Handle" is a bullish continuation pattern that typically forms over several months to over a year, making a "giant" one a long-term pattern.
* **The "Cup":** A "U" shaped formation where the price declines, bottoms out, and then rises back to approximately the original level. The ideal cup has a smooth, rounded bottom (not a sharp "V").
* **The "Handle":** A smaller, shorter consolidation pattern that forms on the right side of the cup, typically with a slight downward drift, often resembling a flag or pennant. It should generally form in the top half of the cup.
* **Breakout:** A decisive move above the resistance level created by the top of the cup and handle, on increased volume, confirms the pattern.
**ARKQ and the Giant Cup and Handle:**
ARKQ, like many growth and tech-focused ETFs, experienced a significant bull run into late 2021/early 2022, followed by a substantial pullback throughout 2022. It then began a recovery phase in late 2022/early 2023.
* **The "Cup":** This pattern would likely be formed by ARKQ's peak in late 2021/early 2022 (around $90-$100), the subsequent decline through 2022 to its lows (around $30-$40), and the long, sustained recovery back towards its previous highs. This entire multi-year U-shaped recovery would constitute the "giant cup." Its recent move to a 52-week high of $89.15 suggests it has almost completed the right side of this cup, nearing the "rim" or previous high.
* **The "Handle":** The "handle" would be a more recent, shorter consolidation that forms as ARKQ approaches that previous high. If ARKQ has been consolidating sideways or with a slight downward drift in the last few weeks or months (e.g., after hitting highs in the $80s and pulling back slightly before pushing higher again today), that could be the "handle" in formation.
**Confirmation:**
For this "giant cup and handle" to be confirmed, ARKQ would need to:
1. **Clearly form a handle:** A distinct period of consolidation (a few weeks to a few months) following the completion of the cup's right side, typically with decreasing volume.
2. **Breakout:** A decisive move above the "rim" of the cup (the previous high, which is also the 52-week high of $89.15, or even higher, if considering a very long-term cup from earlier all-time highs), on strong, increasing volume.
**Significance:** A giant cup and handle, when confirmed, is a powerful bullish continuation pattern. The price target is typically measured by the depth of the cup projected upwards from the breakout point. Given the depth of ARKQ's potential cup (from highs around $90-$100 to lows around $30-$40), the projected upside could be substantial, potentially indicating new all-time highs well beyond its current range.
---
### **MACD (Moving Average Convergence Divergence) (8,13)**
You've requested custom MACD settings (8,13). This makes the indicator more sensitive to recent price movements compared to the standard (12,26) settings.
* **MACD Line:** (8-period EMA of Close - 13-period EMA of Close)
* **Signal Line:** 9-period EMA of the MACD Line
* **MACD Histogram:** MACD Line - Signal Line
**Interpretation of MACD:**
* **MACD Line above Signal Line:** Bullish momentum.
* **MACD Histogram positive and increasing:** Strengthening bullish momentum.
* **MACD Line below Signal Line:** Bearish momentum.
* **MACD Histogram negative and decreasing:** Strengthening bearish momentum.
**Current ARKQ MACD (8,13) State:**
ARKQ has recently reached a new 52-week high, indicative of strong upward momentum.
* It's highly probable that the **MACD Line (8,13) is currently above its Signal Line**. This indicates **bullish momentum**.
* The **MACD Histogram is likely positive**, and given today's slight gain to a new 52-week high, it might still be increasing or holding strong, showing sustained buying pressure.
**Confluence:**
A strong, positive MACD (8,13) would provide bullish confirmation for the potential cup and handle pattern. If the MACD maintains its bullish stance as the handle forms (perhaps showing a slight cooling during the handle's drift but staying positive), and then accelerates again on a breakout, it would be a very strong signal.
---
### **Overall Outlook for ARKQ:**
ARKQ is showing compelling technical formations.
* The **"giant cup and handle" pattern** appears to be in an advanced stage, with the ETF having completed much of the "cup" by nearing its previous multi-year highs. The formation of the "handle" now becomes critical. If it forms constructively and leads to a breakout, it signals a significant bullish continuation with substantial upside potential.
* The **MACD (8,13)** is likely confirming the recent bullish momentum, with the MACD line above its signal line and a positive histogram. This supports the idea that buying pressure remains strong.
**Considerations:**
* **ETF Holdings:** ARKQ is an actively managed ETF. Its performance is tied to the performance of its underlying holdings in autonomous technology and robotics. Understanding the outlook for these sectors is crucial.
* **Volume:** As with any chart pattern, volume confirmation is key. Strong volume on a breakout from the "handle" would lend significant credibility to the pattern.
* **Risk:** While the cup and handle is bullish, no pattern is guaranteed. Monitor for potential failures of the pattern (e.g., breakdown below the handle's support).
This analysis is based on your provided pattern and indicator, combined with current market data. It is not financial advice. Always conduct your own thorough fundamental and technical research and consult with a qualified financial advisor before making any investment decisions.
Disclaimer
The information and publications are not meant to be, and do not constitute, financial, investment, trading, or other types of advice or recommendations supplied or endorsed by TradingView. Read more in the Terms of Use.
Disclaimer
The information and publications are not meant to be, and do not constitute, financial, investment, trading, or other types of advice or recommendations supplied or endorsed by TradingView. Read more in the Terms of Use.