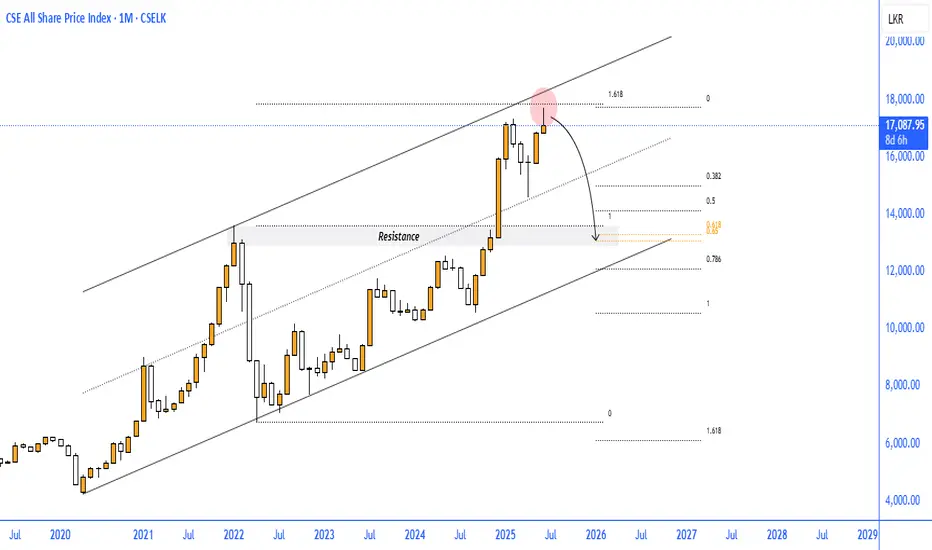
The monthly chart of the CSE All Share Price Index (ASI) reveals a technically significant scenario: the index is currently testing the upper boundary of a long-term ascending channel while also aligning with the 1.618 Fibonacci extension, both of which signal potential reversal pressure ahead.
Key Observations:
Long-Term Resistance: The price is testing the channel’s upper resistance line near the 17,000 – 17,700 zone, where rejection often occurs historically.
Fibonacci Confluence: The current high coincides with the 1.618 Fibonacci extension, a critical level where long rallies often stall or reverse.
Bearish Candlestick Pattern: The formation of a potential bearish reversal candle near the resistance zone is an early signal of seller interest.
Expected Retracement Levels:
Initial support lies at the 0.382 and 0.5 Fibonacci retracement zones, around 15,000 – 14,000.
Deeper correction could target the 0.618 level (~13,000), which aligns with previous breakout structure and the channel midline.
Conclusion:
The ASI appears overextended after a strong bullish leg and is currently showing signs of exhaustion at the top of a multi-year channel. Unless price breaks above and sustains above 17,700, a correction toward the 13,000–14,000 zone is likely, supported by Fibonacci retracement levels and the channel structure.
This presents a potential medium-term bearish outlook for investors and swing traders, with caution advised around current highs.
Related publications
Disclaimer
The information and publications are not meant to be, and do not constitute, financial, investment, trading, or other types of advice or recommendations supplied or endorsed by TradingView. Read more in the Terms of Use.
Related publications
Disclaimer
The information and publications are not meant to be, and do not constitute, financial, investment, trading, or other types of advice or recommendations supplied or endorsed by TradingView. Read more in the Terms of Use.