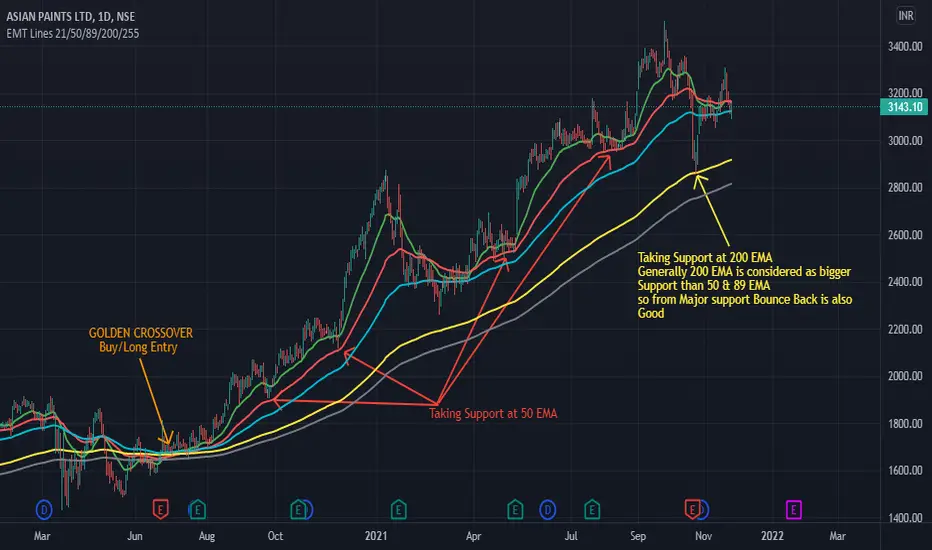
GOLDEN CROSSOVER:-
Golden crossover is a condition when on Daily Time frame "50 Moving Average" Crosses "200 Moving Average" from Down to UP.
this is a good BUY opportunity in many stocks.
So if you see "Golden Crossover" happening You may Take a LONG Posn.
When to Exit this LONG posn depends on your Risk Appetite - You may Exit as per RR ratio - or keeping Slow MA as SL like mentioned above - or waiting for opposite to happen - or Exit as per different TF - or Exit with the help of some other indicator - or any other method you have deviced.
200 EMA Support:-
On Daily Time Frame Most of the Stocks/Indices/Commodities/Forex takes support On(Near) 200 EMA/SMA/DEMA and bounce back from this level. so many traders take LONG posn near 200 EMA/SMA/DEMA etc keeping SL at Support level Below 200 EMA/SMA/DEMA etc for good Risk Reward Ratio.
21/50/89 EMA Support:-
On Daily Time Frame Most of the Stocks/Indices/Commodities/Forex takes support On 21/50/89 EMA/SMA/DEMA also similar to 200 EMA etc and bounce back from this level. so many traders take LONG posn near These EMA/SMA etc keeping SL at Support level Below these 21/50/89 EMA/SMA etc for good Risk Reward Ratio. these show good support at 1Hour ... Weekly ... Monthly and other time frames also. Such stocks you need to identify. one such example is SBIN ... you can find it taking support at 50-89-200 EMA before Bouncing back... another is Ultratech Cement which bounce back from 89 EMA and 200 EMA. So you need to find out these stocks to make an appropriate entry as per your risk level.
I am not a SEBI Registered Analyst. Please Correlate by yourself also on charts. This is for Educational and Paper Trading Purpose Only. Must Consult your financial advisor before Investing.
Hope this helps most people to take basic trade.
Happy Trading !
Disclaimer
The information and publications are not meant to be, and do not constitute, financial, investment, trading, or other types of advice or recommendations supplied or endorsed by TradingView. Read more in the Terms of Use.
Disclaimer
The information and publications are not meant to be, and do not constitute, financial, investment, trading, or other types of advice or recommendations supplied or endorsed by TradingView. Read more in the Terms of Use.