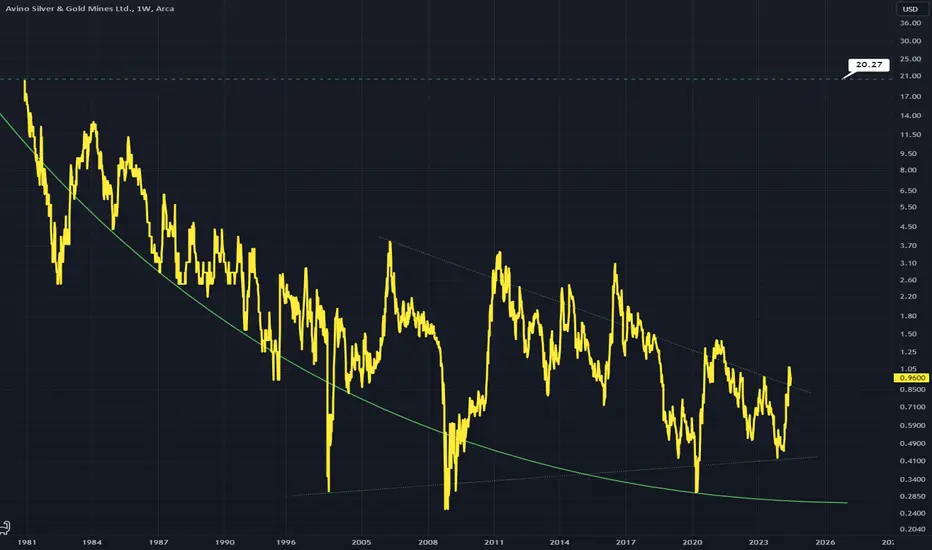
The descending curve is a bullish chart pattern called a descending scallop
Higher lows are also present within the triangle I have drawn
The breakout on this would be pretty aggressive and probably reach right back up to its starting point.
Looks like a crypto chart lol.
Weekly Chart.
Higher lows are also present within the triangle I have drawn
The breakout on this would be pretty aggressive and probably reach right back up to its starting point.
Looks like a crypto chart lol.
Weekly Chart.
Disclaimer
The information and publications are not meant to be, and do not constitute, financial, investment, trading, or other types of advice or recommendations supplied or endorsed by TradingView. Read more in the Terms of Use.
Disclaimer
The information and publications are not meant to be, and do not constitute, financial, investment, trading, or other types of advice or recommendations supplied or endorsed by TradingView. Read more in the Terms of Use.