Weekly chart,
The stock ASPI is trading in an ascending broadening channel.
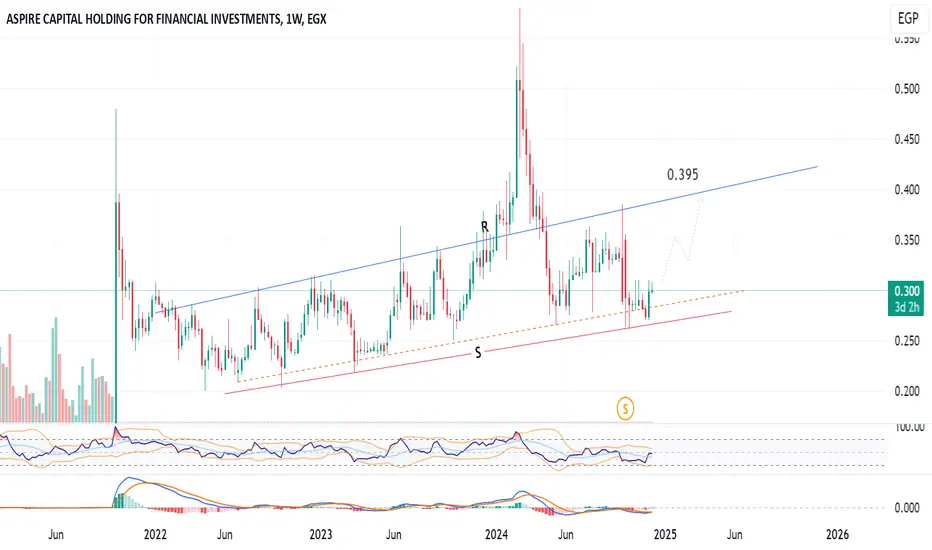
The target is the upper resisitance line R, at around 0.395, expected in 4 months.
Technical indicators RSI and MACD are supporting this positive view.
Consider a near stop loss / profit protection level - as the stock is volatile.
The stock
The target is the upper resisitance line R, at around 0.395, expected in 4 months.
Technical indicators RSI and MACD are supporting this positive view.
Consider a near stop loss / profit protection level - as the stock is volatile.
Disclaimer
The information and publications are not meant to be, and do not constitute, financial, investment, trading, or other types of advice or recommendations supplied or endorsed by TradingView. Read more in the Terms of Use.
Disclaimer
The information and publications are not meant to be, and do not constitute, financial, investment, trading, or other types of advice or recommendations supplied or endorsed by TradingView. Read more in the Terms of Use.