Daily Time-Frame Context


1h Chart

ASST gapped up over 300% pre-market on news of transitioning to a crypto holding company (a strong hype theme).
Despite being in a long-term downtrend, ASST had a history of prior gap-ups in 2023–2025.
Highest daily trading volume (HDW) ever recorded, with 80M shares traded pre-market.
Low short interest (0.5 days) and a relatively small float of 10.9M.
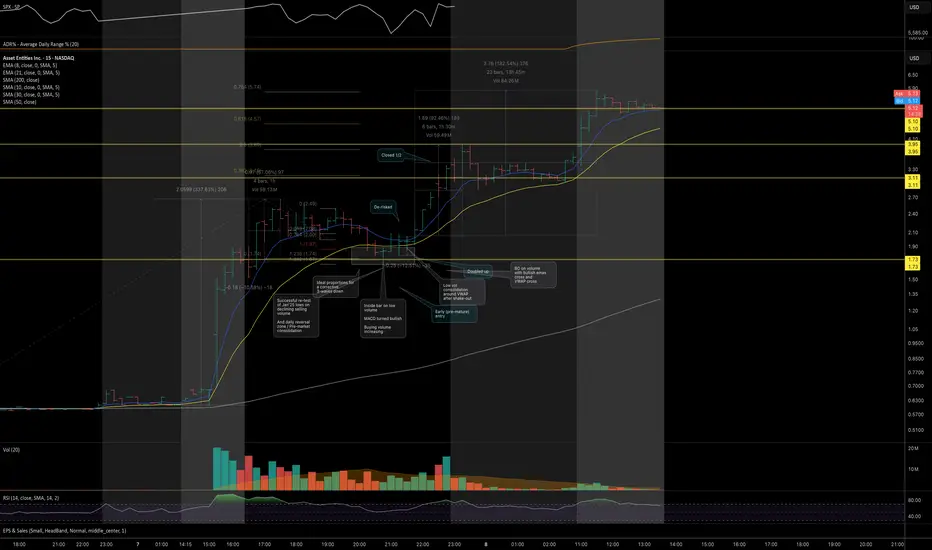
5-Min Time-Frame Analysis

Pre-Market Action:
Gap-up to Jan’25 highs, followed by shallow consolidation to the rising 8 EMA and VWAP (1h 8 EMA)
Opening Price Action:
Mid-Day Movement
Price reached a mid-day top with increased selling volume, reduced buying, bearish MACD, and flattening short-term EMAs.
Pullback Phase
Consolidation and Breakout
Established a solid consolidation at the key support zone, featuring:
Possible Entries
Aggressive Entry:
Failed breakdown and V-shaped reversal with an 11% stop at LOD.
Ideal Entry/Aggressive add-on:
After the shake-out/inside bars sequence on low volume, breakout confirmed by bullish convergence of EMAs and VWAP. Full stop could be placed bellow higher low.
Active Uptrend Phase
Swing-Trading Thesis
1h Chart
ASST gapped up over 300% pre-market on news of transitioning to a crypto holding company (a strong hype theme).
Despite being in a long-term downtrend, ASST had a history of prior gap-ups in 2023–2025.
Highest daily trading volume (HDW) ever recorded, with 80M shares traded pre-market.
Low short interest (0.5 days) and a relatively small float of 10.9M.
5-Min Time-Frame Analysis
Pre-Market Action:
Gap-up to Jan’25 highs, followed by shallow consolidation to the rising 8 EMA and VWAP (1h 8 EMA)
Opening Price Action:
- Price posted a failed breakdown setup, finding support at VWAP, Jan’25 highs, and the pre-market base.
- Selling volume remained low, while reversal volume showed substantial buying interest, with most bars closing at the highs.
- MACD signaled bearish posture during this reversal, hinting at potential upcoming consolidation.
Mid-Day Movement
Price reached a mid-day top with increased selling volume, reduced buying, bearish MACD, and flattening short-term EMAs.
Pullback Phase
- Price pulled back for 4 hours to early morning support (Jan’25 highs, pre-market top, morning reversal), with gradually decreasing volume, indicating drying-up selling interest.
- Pullback had a textbook three-wave structure with ideal Fibonacci proportions.
Consolidation and Breakout
Established a solid consolidation at the key support zone, featuring:
- Several shake-outs
- Buying volume dominating selling
- Sequance of higher lows formation
- Inside bars prior to breakout
- MACD turning bullish
Possible Entries
Aggressive Entry:
Failed breakdown and V-shaped reversal with an 11% stop at LOD.
Ideal Entry/Aggressive add-on:
After the shake-out/inside bars sequence on low volume, breakout confirmed by bullish convergence of EMAs and VWAP. Full stop could be placed bellow higher low.
Active Uptrend Phase
- Price respected the 8 EMA during the active advance phase, pausing only during halts.
- (!) Gradually increasing buying volume without a sudden spike - a sign of steady buying rather than stop-loss coverage.
- Noticeably lower selling volume compared to buying volume.
- Price approached the next significant daily resistance zone at Jan’24 highs - a potential profit-trimming target.
Swing-Trading Thesis
- Strong crypto-related hype (becoming a crypto holding company).
- Crypto sector showing relative strength since the market top and recovery phase.
- Price maintained above key short-term moving averages into the close and post-market, supporting the bullish case.
- Bitcoin pullback and altcoin breakout setups further enhance the thesis.
Daily insights, trend analysis, set-ups and commentary on Crypto and U.S. equities
t.me/MarketArtistryENG
Личные размышления, комментарии о глобальных финансовых рынках и торговые идеи: t.me/marketartistry
t.me/MarketArtistryENG
Личные размышления, комментарии о глобальных финансовых рынках и торговые идеи: t.me/marketartistry
Disclaimer
The information and publications are not meant to be, and do not constitute, financial, investment, trading, or other types of advice or recommendations supplied or endorsed by TradingView. Read more in the Terms of Use.