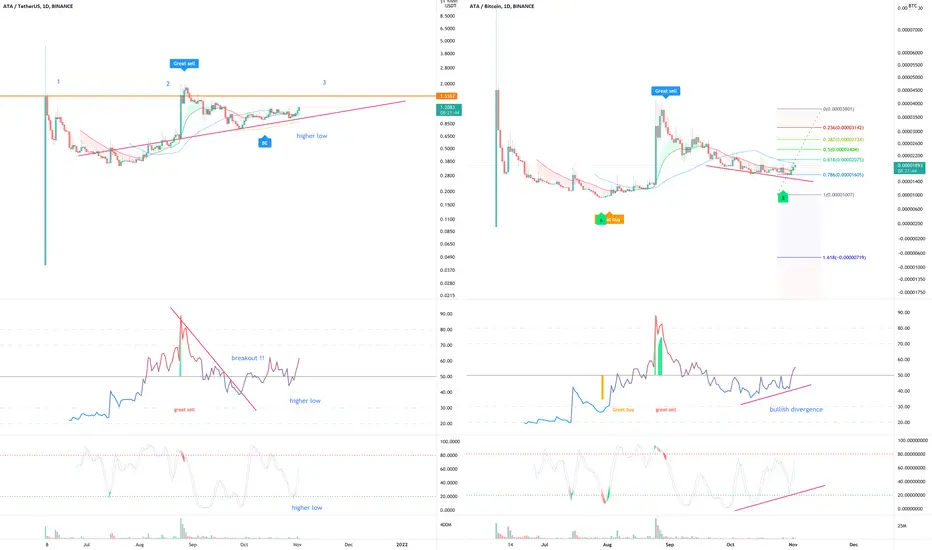
On the above 1-day dollar chart (left) price action is printing higher lows within an ascending triangle formation. On the ATA/BTC chart (right) multiple oscillators are showing bullish divergence with price action following a 55% correction. In fact there is currently 8 oscillators showing bullish divergence - amazing.
There is is no more resistance once price action passes target.
On the weekly USD (below) chart price action breaks out of a pennant formation with flagpole extension to $4.30 or 3.6x from current levels.
Is it possible price action falls? Sure.
Is it probable? Very unlikely.
Good luck.
WW
Weekly USD chart
Trade active
Note
Weekly reversal pattern that was mentioned in the SENSO educational idea is playing out for ATA perfectly. Be patient. Trade active
Trade active
BTC
bc1q2eckdzh0q8vsd7swcc8et6ze7s99khhxyl7zwy
Weblink: patreon.com/withoutworries
Allow 3-6 months on ideas. Not investment advice. DYOR
bc1q2eckdzh0q8vsd7swcc8et6ze7s99khhxyl7zwy
Weblink: patreon.com/withoutworries
Allow 3-6 months on ideas. Not investment advice. DYOR
Disclaimer
The information and publications are not meant to be, and do not constitute, financial, investment, trading, or other types of advice or recommendations supplied or endorsed by TradingView. Read more in the Terms of Use.