Long
$ATH 4 month #AscendingTriangle #ChartPattern
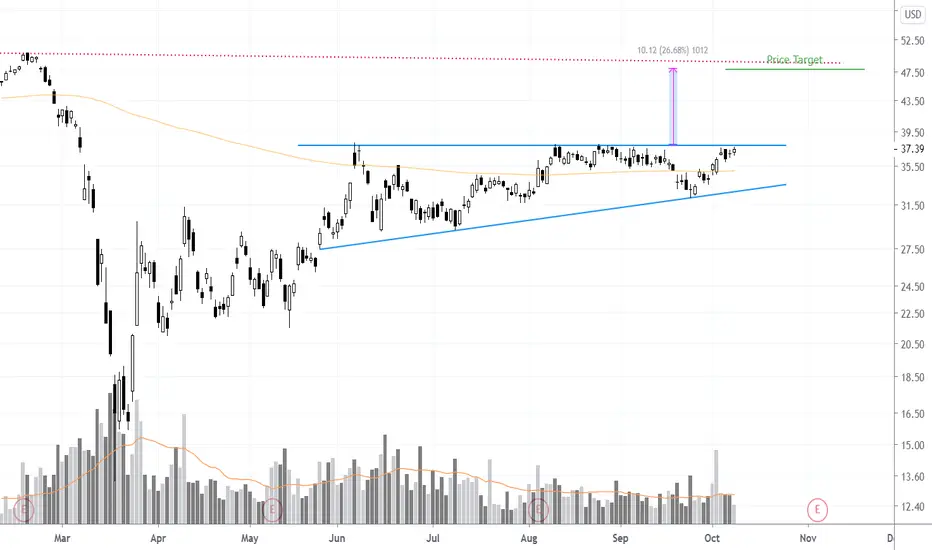
The Financial sector has been on fire the last few days and ATH is one that is setting up nicely for a possible ascending triangle breakout trade.
The pattern horizontal boundary @ $37.85 has been tested multiple times. A daily close above that level will confirm the pattern and triggers a long entry. Chart pattern price target identified on the chart.
The pattern horizontal boundary @ $37.85 has been tested multiple times. A daily close above that level will confirm the pattern and triggers a long entry. Chart pattern price target identified on the chart.
✔ Momentum & Breakout Trader Since 2006 | Influenced by Mark Minervini VCP Trading Style & William O'Neil CANSLIM 📈
✔ Follow me on Twitter @taplot - twitter.com/TaPlot
✔ YouTube channel youtube.com/@taplot
✔ Follow me on Twitter @taplot - twitter.com/TaPlot
✔ YouTube channel youtube.com/@taplot
Disclaimer
The information and publications are not meant to be, and do not constitute, financial, investment, trading, or other types of advice or recommendations supplied or endorsed by TradingView. Read more in the Terms of Use.