Hi All,
~~~ a continuation from the previous post, link below ~~~
Another one I have had my eyes on but with all the things that were happening, I missed the bottom but how many trades can you take?
Having said that, I missed out because I had others on the go and in some cases better trade setup.
Having said that, today's list is shorter and this one stands out for going long.
Observations:
================================================================
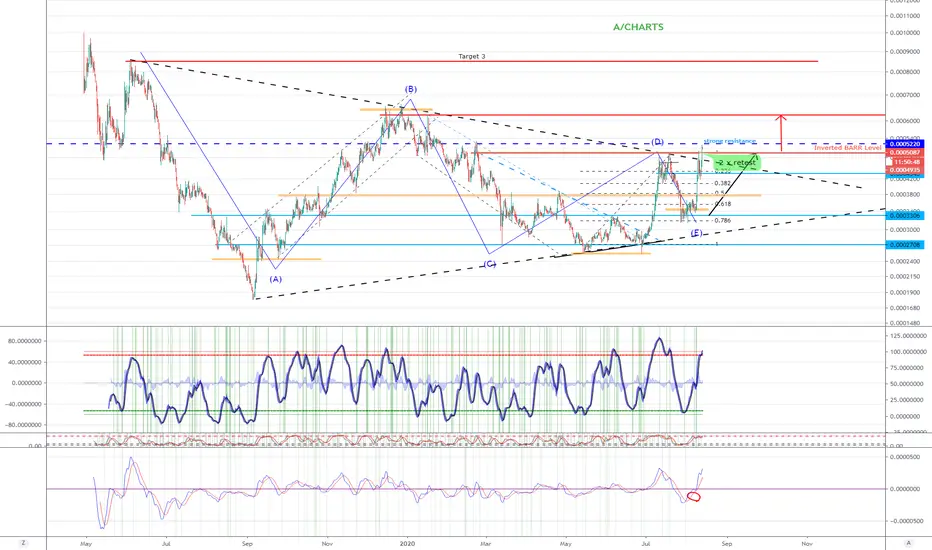
> On the daily, indicators are bullish (eg MACD where the macd line and signal are wide).
> The macro structure is a of Descending (top declining, bottom flat or bottom rising and with a breakout (reversal structure)
> 12 HRLY looks good with the indicators and candle sticks
> 30 minutes we had 2 touches to retest the resistance line (chart below) which was the inverted barr target
How to trade this?
> wait for consolation below the current resistance line and look for a bullish candle on the 4 hrly or 8 hrly
> refer to my 30 min chart with the 21/34 ema
30 min. chart > we had 2 touches to retest on the resistance line


Please give me a like or tick for this post.
Regards,
S.Sari
8 HLRY chart with clearer overview

DAILY chart > macd and WT indicators crossed over for bullish turn

4 HRLY chart, looking for another retouch and hence place your orders there

PREVIOUS POST

~~~ a continuation from the previous post, link below ~~~
Another one I have had my eyes on but with all the things that were happening, I missed the bottom but how many trades can you take?
Having said that, I missed out because I had others on the go and in some cases better trade setup.
Having said that, today's list is shorter and this one stands out for going long.
Observations:
================================================================
> On the daily, indicators are bullish (eg MACD where the macd line and signal are wide).
> The macro structure is a of Descending (top declining, bottom flat or bottom rising and with a breakout (reversal structure)
> 12 HRLY looks good with the indicators and candle sticks
> 30 minutes we had 2 touches to retest the resistance line (chart below) which was the inverted barr target
How to trade this?
> wait for consolation below the current resistance line and look for a bullish candle on the 4 hrly or 8 hrly
> refer to my 30 min chart with the 21/34 ema
30 min. chart > we had 2 touches to retest on the resistance line
Please give me a like or tick for this post.
Regards,
S.Sari
8 HLRY chart with clearer overview
DAILY chart > macd and WT indicators crossed over for bullish turn
4 HRLY chart, looking for another retouch and hence place your orders there
PREVIOUS POST
Note
I made a slight oversight. I havn't seen the sloping trend retested and hence its likely this slope will be retested before the next leg up.Again, using the 8 hrly for a bullish candle at this point.
Note
Still looking positiveNote
slow progress but its doing fineTrade active
It looks like a strong resistance on the weekly candle stick area.I have flipped some days ago to BTC and when this level is broken, I will jump back in.
Trade closed: target reached
Updated my chart, not much change and the level as to why its stuck, its not that obvious.Note
chart adjusted with targets etc and lesson learntDiscord: discord.com/invite/vb4hbP88vb (TradeToProspa)
Telegram: t.me/TprospaTradersbot
This community has signals now but with no risk management comms.
Telegram: t.me/TprospaTradersbot
This community has signals now but with no risk management comms.
Related publications
Disclaimer
The information and publications are not meant to be, and do not constitute, financial, investment, trading, or other types of advice or recommendations supplied or endorsed by TradingView. Read more in the Terms of Use.
Discord: discord.com/invite/vb4hbP88vb (TradeToProspa)
Telegram: t.me/TprospaTradersbot
This community has signals now but with no risk management comms.
Telegram: t.me/TprospaTradersbot
This community has signals now but with no risk management comms.
Related publications
Disclaimer
The information and publications are not meant to be, and do not constitute, financial, investment, trading, or other types of advice or recommendations supplied or endorsed by TradingView. Read more in the Terms of Use.