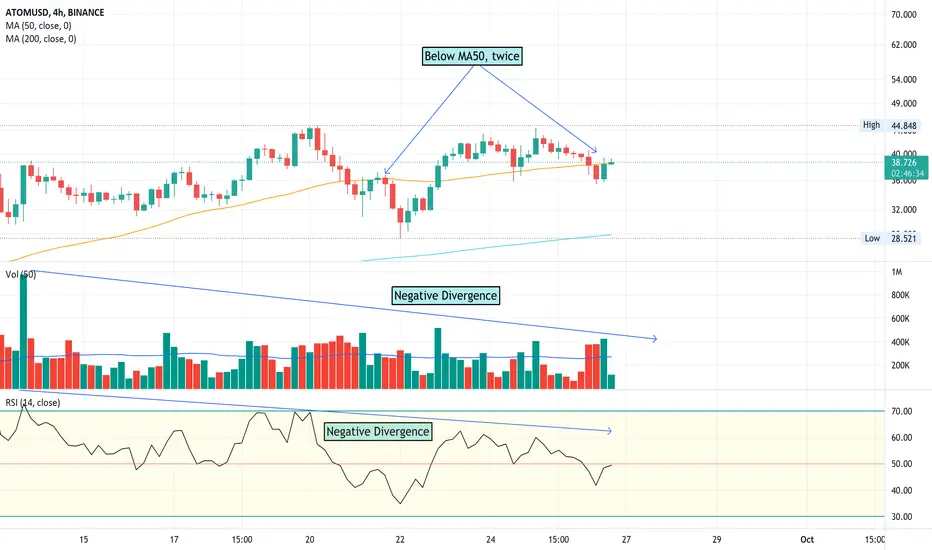
CHART 4H
Based on Japanese Candles, we have the second test MA50 but price can't close above MA50 within a huge volume. Besides, RSI has a negative signal.
I think that is bad for ATOM next week.
----

CHART 1H
Seem ATOM is in a correction wave ABC with wave C is progressing.
I think that is a flat wave because wave B is done nearly the beginning of wave A.
If that's true, wave C will done at around 28.5
Let's wait and see
Based on Japanese Candles, we have the second test MA50 but price can't close above MA50 within a huge volume. Besides, RSI has a negative signal.
I think that is bad for ATOM next week.
----
CHART 1H
Seem ATOM is in a correction wave ABC with wave C is progressing.
I think that is a flat wave because wave B is done nearly the beginning of wave A.
If that's true, wave C will done at around 28.5
Let's wait and see
📱Copy Trade on BingX: bit.ly/48OD3GI
📱Copy Trade on Binance: bit.ly/3NHOTKQ
🔐 Buy Cold Wallet Ledger bit.ly/3OmOrBe
💬 Tele: t.me/trieutv_official
📱Copy Trade on Binance: bit.ly/3NHOTKQ
🔐 Buy Cold Wallet Ledger bit.ly/3OmOrBe
💬 Tele: t.me/trieutv_official
Disclaimer
The information and publications are not meant to be, and do not constitute, financial, investment, trading, or other types of advice or recommendations supplied or endorsed by TradingView. Read more in the Terms of Use.