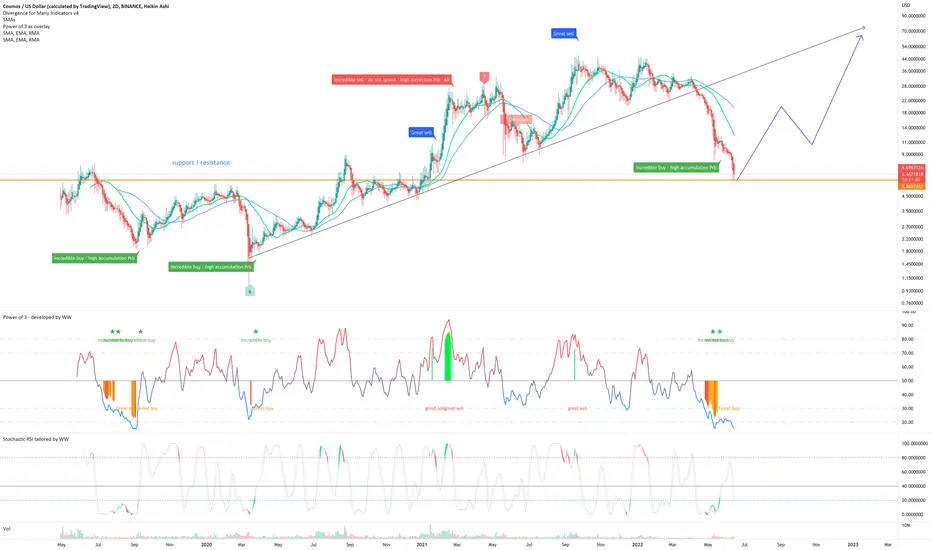
On the above 2-day chart price action has corrected almost 90% since the year began. A number of reasons now exist to be long, including:
1) The ‘incredible buy’ signal prints.
2) Price action testing past resistance as support.
3) 1 & 2 is also true for the 3-day BTC pair (below).
4) ATOM price action finds itself on the ‘what if’ list. I don’t know how, but that’s the fact of the chart.
Is it possible price action falls further? Sure.
Is it probable? No.
Good luck!
Ww
Type: trade
Risk: <=6% of portfolio
Timeframe: 4 to 7 months
Return: 10x
3-day BTC pair
Note
Don't know why I went all Heikin Ashi on those charts. Here is the 3-day with normal candles:Trade active
Note
Something just noticed on the weekly BTC pair. A bullish engulfing candle on a 'great buy' signal, how can you ignore that?Trade active
don't let these moments pass you byNote
Up 20% since signalNote
Would you like to know where the first resistance is? Get this idea up to 100 likes then!Note
Up 50% so far and about to move up a whole lot more. Anyone else want to play with cupcake?Note
Up 90%, not bad. Almost at the first resistance test point, $12.40Note
3hr chart, is this a good time to buy? You tell me ;)Trade active
Currently up 80%. A new 70%+ move is coming to just over $18.2-day chart. A life cross is printed with price action finding support on the 2-day/50-day moving average. All good.
Trade active
Note
Correction to $11.30BTC
bc1q2eckdzh0q8vsd7swcc8et6ze7s99khhxyl7zwy
Weblink: patreon.com/withoutworries
Allow 3-6 months on ideas. Not investment advice. DYOR
bc1q2eckdzh0q8vsd7swcc8et6ze7s99khhxyl7zwy
Weblink: patreon.com/withoutworries
Allow 3-6 months on ideas. Not investment advice. DYOR
Related publications
Disclaimer
The information and publications are not meant to be, and do not constitute, financial, investment, trading, or other types of advice or recommendations supplied or endorsed by TradingView. Read more in the Terms of Use.
BTC
bc1q2eckdzh0q8vsd7swcc8et6ze7s99khhxyl7zwy
Weblink: patreon.com/withoutworries
Allow 3-6 months on ideas. Not investment advice. DYOR
bc1q2eckdzh0q8vsd7swcc8et6ze7s99khhxyl7zwy
Weblink: patreon.com/withoutworries
Allow 3-6 months on ideas. Not investment advice. DYOR
Related publications
Disclaimer
The information and publications are not meant to be, and do not constitute, financial, investment, trading, or other types of advice or recommendations supplied or endorsed by TradingView. Read more in the Terms of Use.