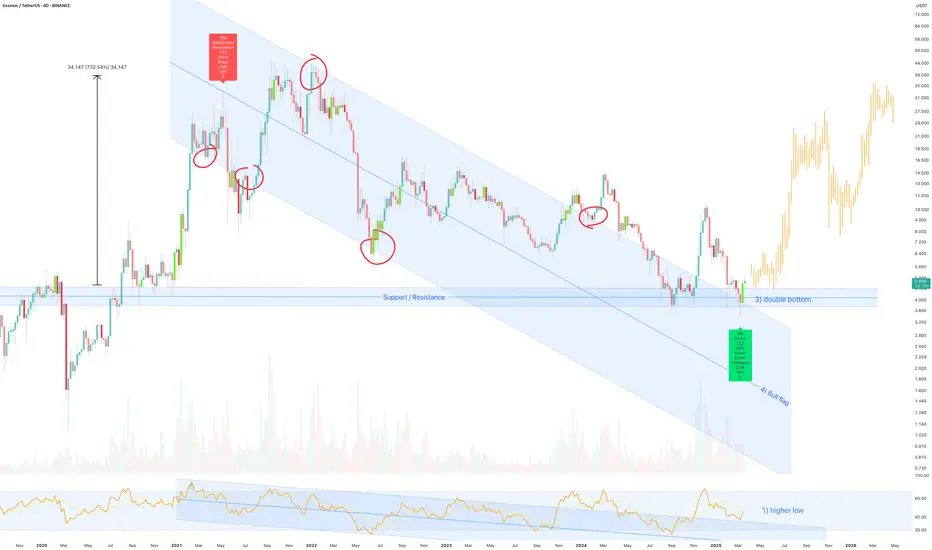
On the above 6 day chart price action has corrected 90% since early 2022. A number of reasons now exist to be long, they include:
1) A trend change in RSI. In fact the first higher low to print since exiting the downtrend in June 2020.
2) Regular bullish divergence as measured over 3 months.
3) Double bottom print on legacy support.
4) The bull flag forecasts price action to the late $30 area perhaps $38.
Is it possible price action continues correcting? Sure.
Is it probable? No.
Ww
Trade active
Active on publication.Trade closed: stop reached
For the moment, broken market structure. Bulls MUST push price action back over $4.50, and with volume.$1.50 is the next support test should broken market structure fail to recover.
BTC
bc1q2eckdzh0q8vsd7swcc8et6ze7s99khhxyl7zwy
Weblink: patreon.com/withoutworries
Allow 3-6 months on ideas. Not investment advice. DYOR
bc1q2eckdzh0q8vsd7swcc8et6ze7s99khhxyl7zwy
Weblink: patreon.com/withoutworries
Allow 3-6 months on ideas. Not investment advice. DYOR
Disclaimer
The information and publications are not meant to be, and do not constitute, financial, investment, trading, or other types of advice or recommendations supplied or endorsed by TradingView. Read more in the Terms of Use.