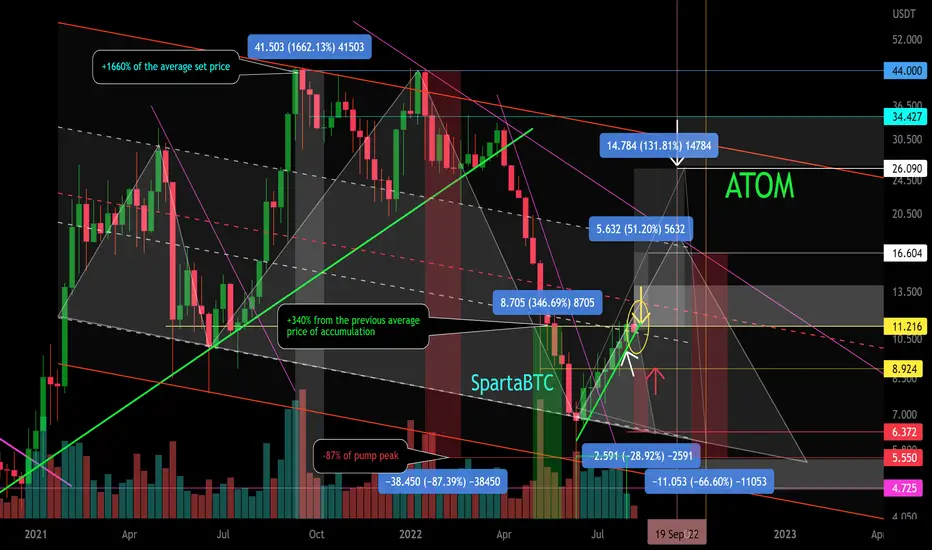
Secondary trend. Time frame 1 week. Logarithm. Showing % of potential reversal zones depending on the overall situation in the crypto market.
Coinmarketcap: Cosmos
Line graph.

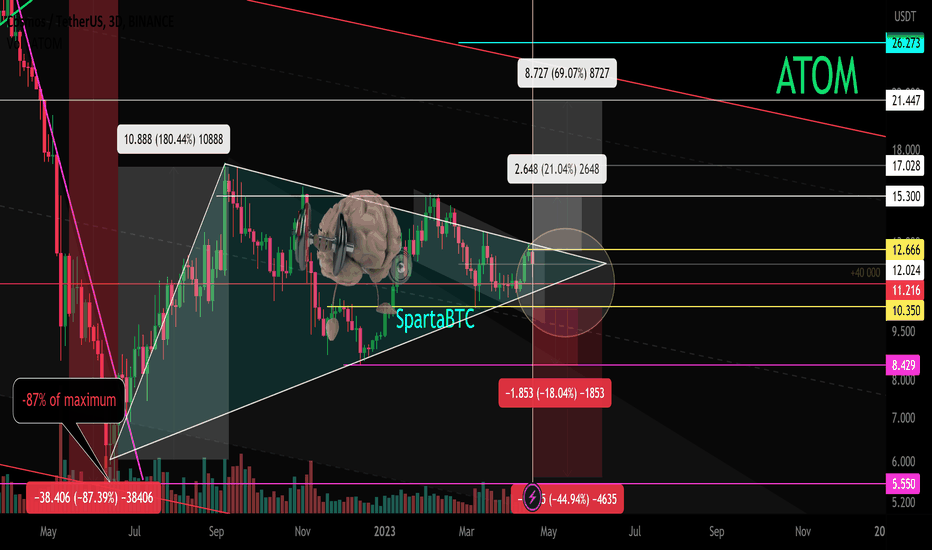
Local trend. Pivot zone. Time frame 1 day.

Main Trend Look at my previous idea published half a year ago by clicking on the "play" button on the price chart.
ATOM/USDT Main Trend. Channel. The important zone.
Coinmarketcap: Cosmos
Line graph.
Local trend. Pivot zone. Time frame 1 day.
Main Trend Look at my previous idea published half a year ago by clicking on the "play" button on the price chart.
ATOM/USDT Main Trend. Channel. The important zone.
Note
Note
Note
Note
From the pivot level of 8,429 +80%,
From the level of 11,216 about +35%
Note
Note
Note
Note
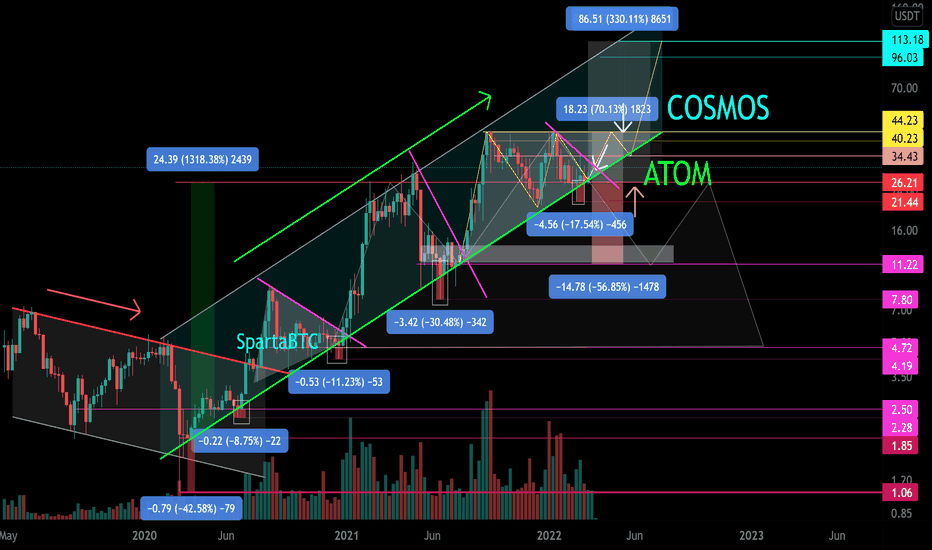
The main trend. Time frame 1 week.Note
✅ Telegram. Finance + Trading: t.me/SpartaBTC_1318
✅ Telegram. Сrypto trading only: t.me/SpartaBTC_tradingview
✅ Instagram: instagram.com/spartabtc_1318
✅ YouTube (Rus): goo.su/vpRzRa2
✅ Telegram. Сrypto trading only: t.me/SpartaBTC_tradingview
✅ Instagram: instagram.com/spartabtc_1318
✅ YouTube (Rus): goo.su/vpRzRa2
Related publications
Disclaimer
The information and publications are not meant to be, and do not constitute, financial, investment, trading, or other types of advice or recommendations supplied or endorsed by TradingView. Read more in the Terms of Use.