🔍 Technical Structure & Price Action:
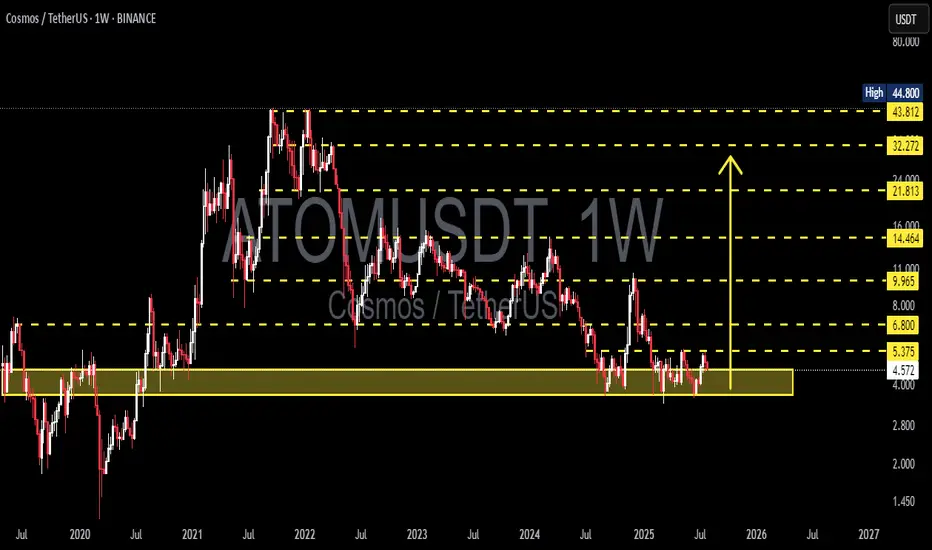
ATOM has been in a prolonged downtrend since peaking at $44.80 in 2022, forming consistent lower highs and lower lows. However, the price has recently returned to a major long-term demand zone between $4.00 – $5.37, which has historically acted as a strong support since 2020.
The price is showing a bullish reaction from this level, indicating a potential trend reversal or relief rally.
---
🧱 Key Levels & Technical Zones:
Level Role
$4.00 - $5.37 Major Historical Demand Zone (Strong Support) 🟨
$6.80 Minor Resistance & Double Bottom Neckline
$9.96 Mid-Term Key Resistance
$14.46 Next Bullish Target If Breakout Holds
$21.81 Major Resistance Ahead
$32.27 - $43.81 Long-Term Distribution Zone / ATH Range
$44.80 All-Time High (ATH)
---
📐 Patterns and Price Behavior:
🟡 1. Potential Double Bottom (Reversal Pattern)
The price appears to be forming a double bottom structure with a neckline around $6.80. A successful breakout above this level could signal a confirmed trend reversal.
🟡 2. Sideways Accumulation
ATOM has been ranging sideways within a tight zone, suggesting institutional accumulation before a possible impulse breakout.
🟡 3. Volume Compression
Declining volume near support often precedes a strong breakout move, either up or down.
---
✅ Bullish Scenario:
Price continues to hold above the $4.00 – $5.37 demand zone.
If weekly candle closes above $6.80, bullish confirmation is triggered.
Potential targets:
Short-Term: $9.96
Mid-Term: $14.46 – $21.81
Long-Term: $32.27 – $43.81 (if momentum sustains)
📈 Confirmation Signs:
Break and weekly close above $6.80
Increasing breakout volume
RSI divergence from oversold territory
---
⚠️ Bearish Scenario:
If price breaks down below $4.00, bears could regain control.
Possible downside targets:
Next Support: $2.80
Breakdown invalidates the double bottom structure
Continuation of macro downtrend likely
📉 Confirmation Signs:
Strong weekly close below $4.00
Spike in selling volume
Failure to break $6.80 resistance
---
🎯 Conclusion & Strategy:
ATOM is sitting at a make-or-break level, where a strong historical support zone meets growing bullish momentum. If bulls manage to break above $6.80, it could trigger a multi-week rally toward mid-term targets. This setup presents a high reward-to-risk opportunity if managed correctly.
---
⚙️ Trading Strategy Suggestion:
Aggressive Entry: Within $5.00 - $5.37 zone, stop loss below $4.00
Conservative Entry: After confirmed breakout above $6.80
Take-Profit Zones: $9.96 → $14.46 → $21.81
Risk Management is a MUST 🚨
#ATOMUSDT #Cosmos #CryptoAnalysis #DoubleBottom #AltcoinOutlook #TechnicalAnalysis #SupportResistance #PriceAction #CryptoTrading #BreakoutWatch #TrendReversal
✅ Get Free Signals! Join Our Telegram Channel Here: t.me/TheCryptoNuclear
✅ Twitter: twitter.com/crypto_nuclear
✅ Join Bybit : partner.bybit.com/b/nuclearvip
✅ Benefits : Lifetime Trading Fee Discount -50%
✅ Twitter: twitter.com/crypto_nuclear
✅ Join Bybit : partner.bybit.com/b/nuclearvip
✅ Benefits : Lifetime Trading Fee Discount -50%
Disclaimer
The information and publications are not meant to be, and do not constitute, financial, investment, trading, or other types of advice or recommendations supplied or endorsed by TradingView. Read more in the Terms of Use.