1. Technical Overview:
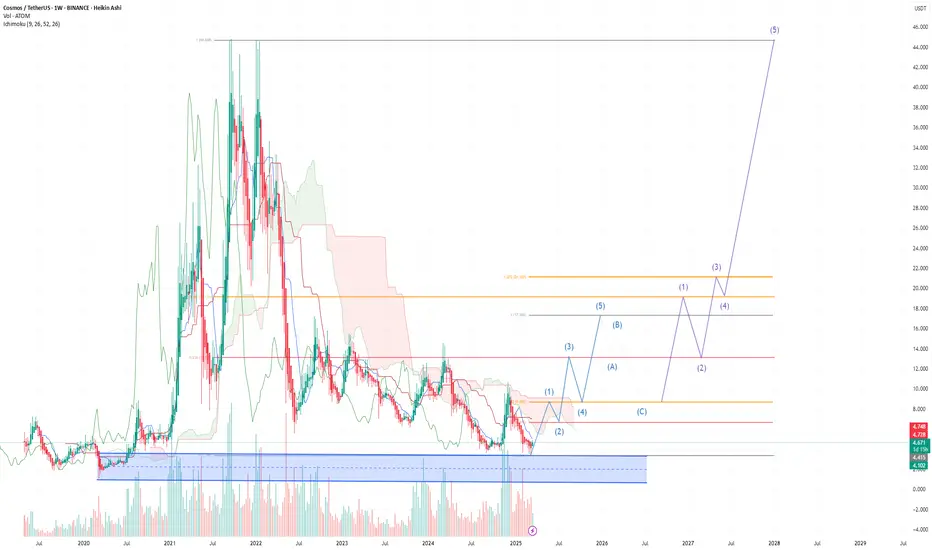
Strong Support Zone: ATOM is currently bouncing from a strong support zone around 4.1 - 4.5 USDT (highlighted in the blue area below). This has been a key accumulation zone since 2019-2020.
Elliott Wave Structure:
The first (1)-(2)-(3)-(4)-(5) wave sequence projects towards the 14-17 USDT range (by around 2026).
Followed by an ABC corrective wave towards approximately 8-10 USDT.
Then, a larger bullish impulse targeting 45-46 USDT (major wave (5) around 2028).
Ichimoku Cloud:
Price is still below the Ichimoku Cloud on the weekly chart (bearish bias on the long-term).
However, price is testing a key bottom and showing accumulation signs at this support.
2. Long-Term ATOM Trading Strategy
Primary Scenario (Bullish Bias):
Entry Zone: Buy around the current level at 4.5 - 5.0 USDT (current price is ~4.67 USDT).
Stop Loss: Below 3.8 - 4.0 USDT (below the key support).
Take Profits based on Elliott Waves:
TP1: 9 - 10 USDT (completion of mini wave (1)).
TP2: 14 - 17 USDT (completion of mini wave (5) in 2026).
TP3: 22 USDT (major wave (3) target).
Final TP: 45 USDT (completion of major wave (5) projected around 2028).
Alternative Scenario (Bearish):
If the price breaks below 3.8 USDT, the next potential bottom could be around 2.5 - 3.0 USDT (historical lows).
3. Supporting Factors:
Long-term Accumulation: The 4.5 USDT level has acted as a strong base for multiple years.
Volume: Volume is starting to rise slightly at these lower levels, signaling accumulation.
Cycle Data: The Elliott Wave suggests a potential for a strong multi-year bull cycle (2025-2028).
4. Notes:
The chart is using Heikin Ashi candles, which smooth out the trend compared to regular candlesticks.
This is a multi-year strategy, ideal for mid to long-term investors.
Disclaimer
The information and publications are not meant to be, and do not constitute, financial, investment, trading, or other types of advice or recommendations supplied or endorsed by TradingView. Read more in the Terms of Use.
Disclaimer
The information and publications are not meant to be, and do not constitute, financial, investment, trading, or other types of advice or recommendations supplied or endorsed by TradingView. Read more in the Terms of Use.