Cosmos (ATOM) technical analysis:
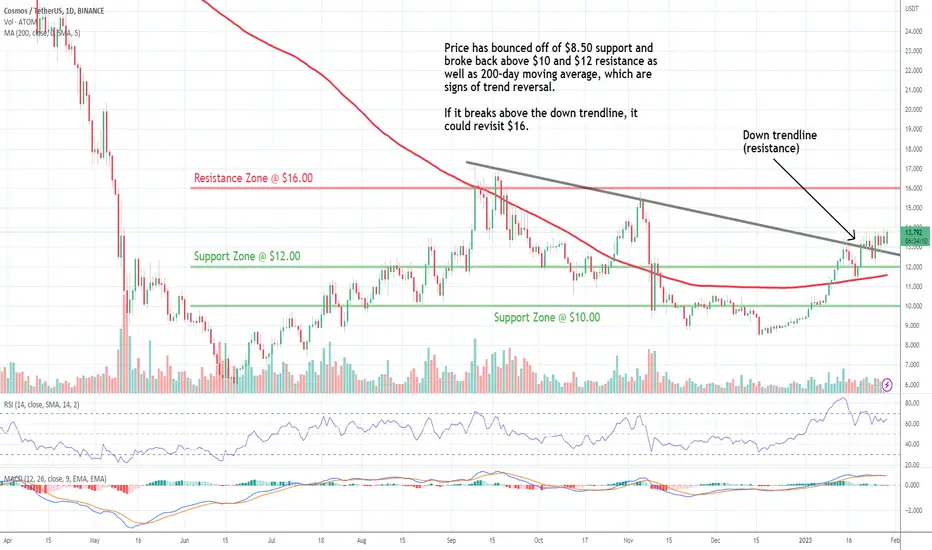
Trade setup: Price has bounced off of $8.50 support and broke back above $10 and $12 resistance as well as 200-day moving average. It also made a Higher High, which are all signs of bullish trend reversal. If it breaks above the down trendline, it could revisit $16.
Trend: Uptrend on Short- and Medium-Term basis and Neutral on Long-Term basis.
Momentum is Mixed as MACD Line is below MACD Signal Line (Bearish) but RSI > 55 (Bullish).
Support and Resistance: Nearest Support Zone is $12.00 (previous resistance), then $10.00. The nearest Resistance Zone is $16.00.
Disclaimer
The information and publications are not meant to be, and do not constitute, financial, investment, trading, or other types of advice or recommendations supplied or endorsed by TradingView. Read more in the Terms of Use.
Disclaimer
The information and publications are not meant to be, and do not constitute, financial, investment, trading, or other types of advice or recommendations supplied or endorsed by TradingView. Read more in the Terms of Use.