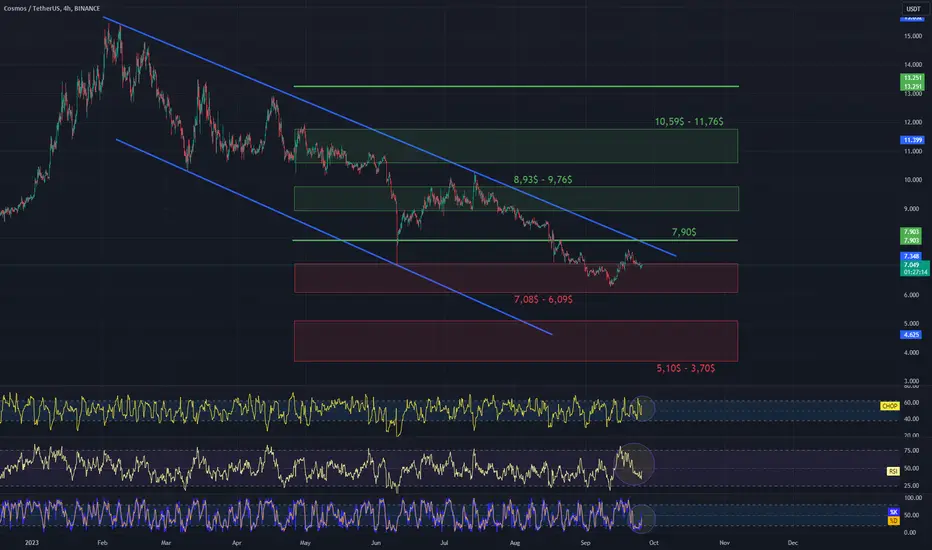
Hello everyone, I invite you to review the ATOM chart in pair with USDT. First, we will use the blue lines to mark the downward trend channel in which the price moves in the upper range.
Going further, we can move on to marking support areas when we start a larger correction. And here you can see that the price remains at the support zone from $7.08 to $6.09, but if we fall lower, the next support zone starts at $5.10 and ends at $3.70.
Looking the other way, we see that the price currently does not have the strength to break the resistance at $7.90, but when it does, it will move towards the first resistance zone from $8.93 to $9.76, and then towards the second zone from $10.59 to $11.76, then we have strong resistance at $13.25.
Please look at the CHOP index, which indicates that we are quickly regaining energy for a new move, on the RSI we are in the process of recovery, which creates room for new increases, but the STOCH indicator shows that the dynamic movement of energy gives a very small price increase on the chart, which may translate into price recovery again.
Disclaimer
The information and publications are not meant to be, and do not constitute, financial, investment, trading, or other types of advice or recommendations supplied or endorsed by TradingView. Read more in the Terms of Use.
Disclaimer
The information and publications are not meant to be, and do not constitute, financial, investment, trading, or other types of advice or recommendations supplied or endorsed by TradingView. Read more in the Terms of Use.