In my previous analysis on AUD 200, we met our First Take Profit levels
Our first TP level was coinciding with key Fib levels and as expected, we are finding selling pressure there.
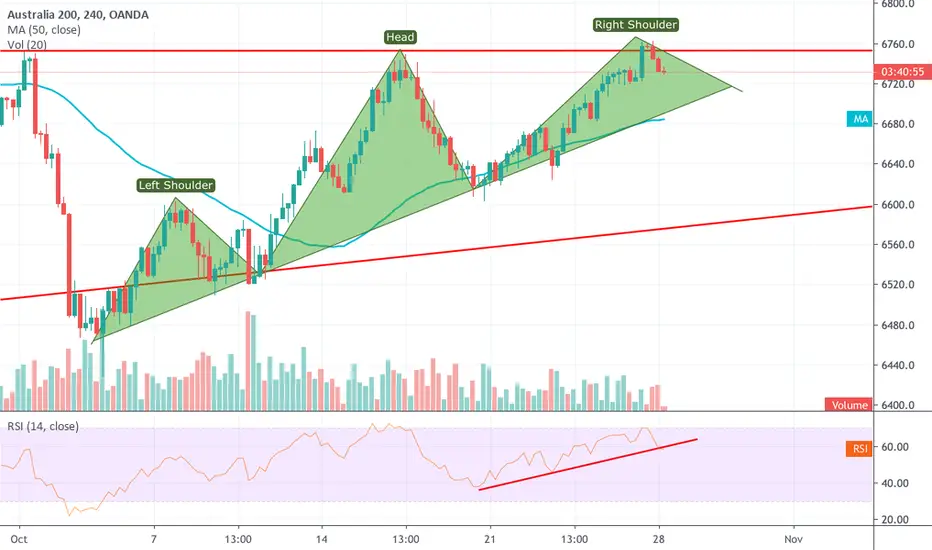
So I decided to go down to 4 hours charts, and to see if there is any cue there to see the expected direction.
Following observation,
1. I drew a trend line on the RSI and a break below may indicate change in current upward move and may showcase caution and further analysis
2. The price action may just be creating a head and shoulder pattern, generally at market tops, indication price may exit downwards, but its too early as the right shoulder is not ready yet
Keep a close eye on this chart.
If you like it, please share a thumbs up and your comments will be highly appreciated
Our first TP level was coinciding with key Fib levels and as expected, we are finding selling pressure there.
So I decided to go down to 4 hours charts, and to see if there is any cue there to see the expected direction.
Following observation,
1. I drew a trend line on the RSI and a break below may indicate change in current upward move and may showcase caution and further analysis
2. The price action may just be creating a head and shoulder pattern, generally at market tops, indication price may exit downwards, but its too early as the right shoulder is not ready yet
Keep a close eye on this chart.
If you like it, please share a thumbs up and your comments will be highly appreciated
Trade closed: target reached
As discussed, the market did create and complete the head and shoulder pattern and exited downwards, giving a sweet income (100 plus points)If you like, please share a thumbs up
If you love what you see, pls share a thumbs up and a comment in the section below
Disclaimer
The information and publications are not meant to be, and do not constitute, financial, investment, trading, or other types of advice or recommendations supplied or endorsed by TradingView. Read more in the Terms of Use.