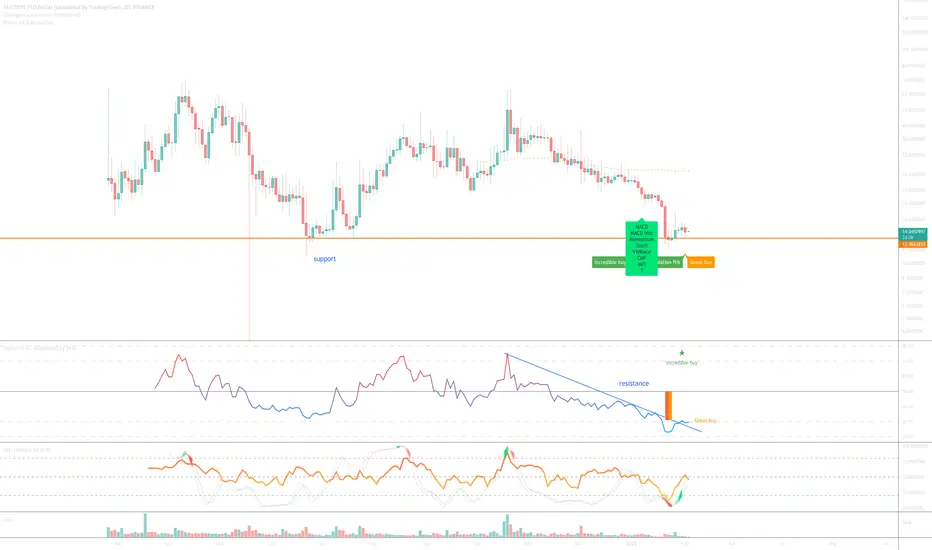
On the above 2-day chart price action has corrected 80% since mid-October. Ouch. A number of reasons now exist to be bullish, including:
1) The ‘incredible buy’ signal prints.
2) Broken RSI resistance
3) Price action is on past support / resistance.
4) The 2-day BTC pair also prints a buy signal with broken MFI resistance.
5) Lastly, volume. I don’t know why, there’s consistent volume no matter the exchange, coinbase pro, Binance, someone / some group is accumulating.
Is it possible price action falls further? Sure.
Is it probable? No.
Target area $70
Good luck!
WW
2-day AUCTION / BTC pair
Trade active
20% so far. Target area remains valid.Trade active
The 2-day BTC pair chart below. There's a significant number of oscillators printing bullish divergence. Not something you see everyday, don't ignore it!Trade active
Note
Forgot to add the chart in last update. The 2-day chart below is printing a strong bullish divergence. Once price action gets to $40 there will be no more resistance until $70.Trade active
Trade active
Trade active
Might be an excellent moment to take a long position. Why?1) Long term price action resistance breakout + confirmed backtest.
2) This is also true on the 3-day BTC pair
Remember, this is a a ‘what if’ list token
Note
2-day chart falling wedge with 200%+ flagpole extension. Would expect the flagpole to print print before end of October. If you're a pattern trader, you live for those simple set ups.Trade active
wedge breakoutTrade active
Trade active
Can't be bothered writing a new idea.Something is about to happen, something wonderful.
BTC
bc1q2eckdzh0q8vsd7swcc8et6ze7s99khhxyl7zwy
Weblink: patreon.com/withoutworries
Allow 3-6 months on ideas. Not investment advice. DYOR
bc1q2eckdzh0q8vsd7swcc8et6ze7s99khhxyl7zwy
Weblink: patreon.com/withoutworries
Allow 3-6 months on ideas. Not investment advice. DYOR
Disclaimer
The information and publications are not meant to be, and do not constitute, financial, investment, trading, or other types of advice or recommendations supplied or endorsed by TradingView. Read more in the Terms of Use.