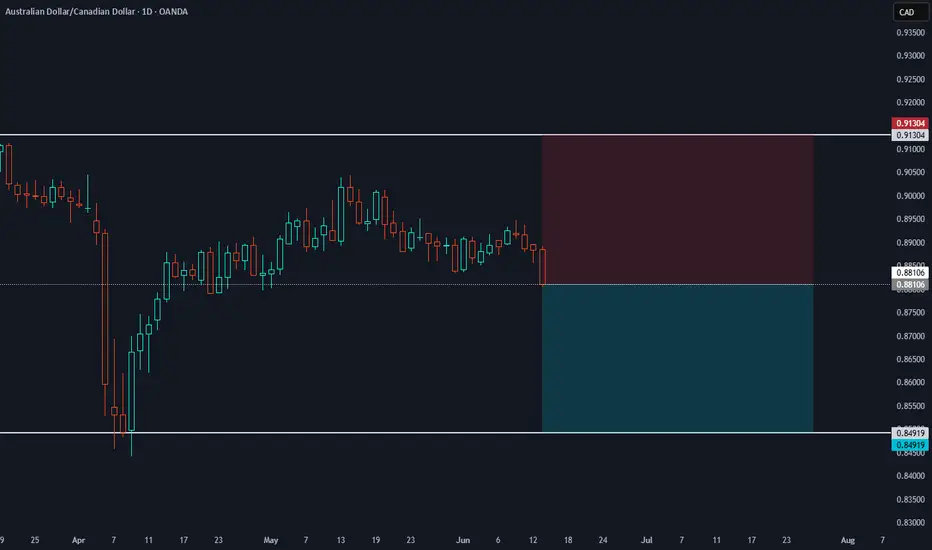
For AUD/CAD at 0.8811 here, I’d estimate roughly:
Rally above 0.9130 first ~35%
Drop below 0.8492 first ~65%
Why the skew toward the downside?
Recent rejection at 0.9130 – price failed there in late Feb/Mar and again in June, showing that ceiling still holds.
Lower‐high bias – since topping at 0.9130, each bounce has come in lower (now around 0.887 → 0.899 → 0.887), hinting at sellers stepping in earlier.
Momentum cooling – the last few daily candles are firm to the downside with little bullish follow‐through, suggesting a greater chance to test the bottom of the band before tagging the top.
Disclaimer
The information and publications are not meant to be, and do not constitute, financial, investment, trading, or other types of advice or recommendations supplied or endorsed by TradingView. Read more in the Terms of Use.
Disclaimer
The information and publications are not meant to be, and do not constitute, financial, investment, trading, or other types of advice or recommendations supplied or endorsed by TradingView. Read more in the Terms of Use.