🧠 Market Sentiment by Timeframe
Weekly (W): Bearish
Daily (D): Bullish
12H, 6H, 4H: Bearish
Bias: Short-term continuation to the downside after retest of supply/imbalance.
🔍 Technical Breakdown
🔴 1. Structure & Momentum
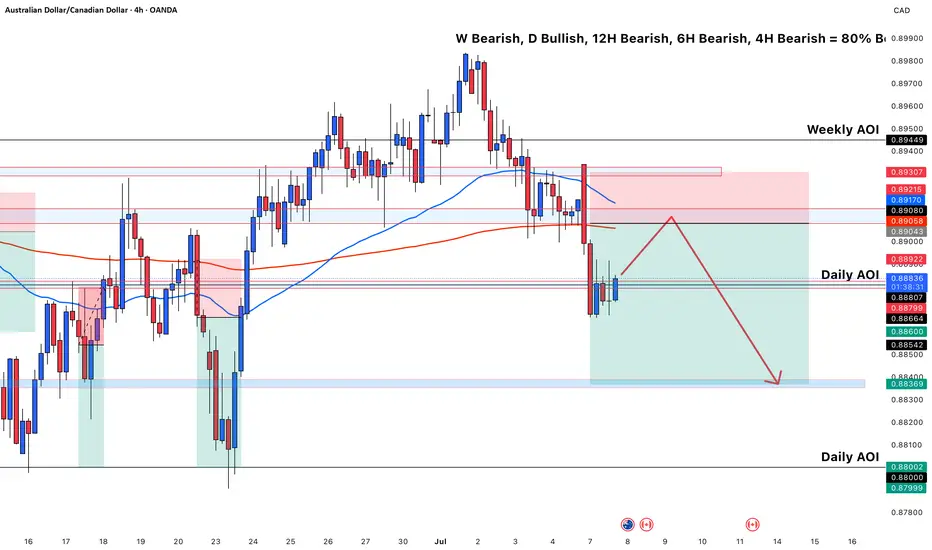
Price broke down from previous 4H support (~0.88900–0.89000) creating a lower low.
A bearish BOS confirms momentum shift.
Price is now consolidating below the 200 EMA and 50 EMA → indicating bearish pressure.
🟥 2. Weekly AOI / Supply Zone
Red box above (0.89058–0.89307) marks Weekly AOI (Supply).
It represents a strong resistance area where price previously sold off.
Expected lower high (LH) to form at the retest of this supply.
🟦 3. Trade Plan
Entry Zone: Anticipated pullback into 0.88922–0.89058 (Daily AOI + 200 EMA resistance).
Stop Loss: Above the Weekly AOI at ~0.89307.
Take Profit (TP): Toward the Daily AOI around 0.88000–0.87999, a previous demand zone.
RR: Over 2:1 potential, depending on exact entry.
🔵 4. EMA Dynamics
Price currently sits below both the 50 EMA (blue) and 200 EMA (red), confirming bearish alignment.
EMAs act as dynamic resistance zones, giving confluence to the short.
📉 Bearish Confluences
Bearish market structure on 4H, 6H, 12H.
EMA crossover and rejection.
Weekly AOI = major supply.
Daily AOI just rejected.
Anticipated lower high to form before continuation.
✅ Summary of Setup
Type: Counter-trend against Daily bullish bias, with HTF bearish confirmation.
Setup: Pullback → rejection → short continuation.
Target: Clean sweep of liquidity near 0.8800 Daily AOI.
Weekly (W): Bearish
Daily (D): Bullish
12H, 6H, 4H: Bearish
Bias: Short-term continuation to the downside after retest of supply/imbalance.
🔍 Technical Breakdown
🔴 1. Structure & Momentum
Price broke down from previous 4H support (~0.88900–0.89000) creating a lower low.
A bearish BOS confirms momentum shift.
Price is now consolidating below the 200 EMA and 50 EMA → indicating bearish pressure.
🟥 2. Weekly AOI / Supply Zone
Red box above (0.89058–0.89307) marks Weekly AOI (Supply).
It represents a strong resistance area where price previously sold off.
Expected lower high (LH) to form at the retest of this supply.
🟦 3. Trade Plan
Entry Zone: Anticipated pullback into 0.88922–0.89058 (Daily AOI + 200 EMA resistance).
Stop Loss: Above the Weekly AOI at ~0.89307.
Take Profit (TP): Toward the Daily AOI around 0.88000–0.87999, a previous demand zone.
RR: Over 2:1 potential, depending on exact entry.
🔵 4. EMA Dynamics
Price currently sits below both the 50 EMA (blue) and 200 EMA (red), confirming bearish alignment.
EMAs act as dynamic resistance zones, giving confluence to the short.
📉 Bearish Confluences
Bearish market structure on 4H, 6H, 12H.
EMA crossover and rejection.
Weekly AOI = major supply.
Daily AOI just rejected.
Anticipated lower high to form before continuation.
✅ Summary of Setup
Type: Counter-trend against Daily bullish bias, with HTF bearish confirmation.
Setup: Pullback → rejection → short continuation.
Target: Clean sweep of liquidity near 0.8800 Daily AOI.
Disclaimer
The information and publications are not meant to be, and do not constitute, financial, investment, trading, or other types of advice or recommendations supplied or endorsed by TradingView. Read more in the Terms of Use.
Disclaimer
The information and publications are not meant to be, and do not constitute, financial, investment, trading, or other types of advice or recommendations supplied or endorsed by TradingView. Read more in the Terms of Use.