As anticipated, the Bullish Shark Pattern has initiated its move on the Weekly Chart—a prediction I shared as early as October 8, 2023. For visual confirmation, refer to the chart within this Trading View post.
Now, attention shifts towards the potential emergence of the bearish 5-0 pattern on the Weekly Chart.
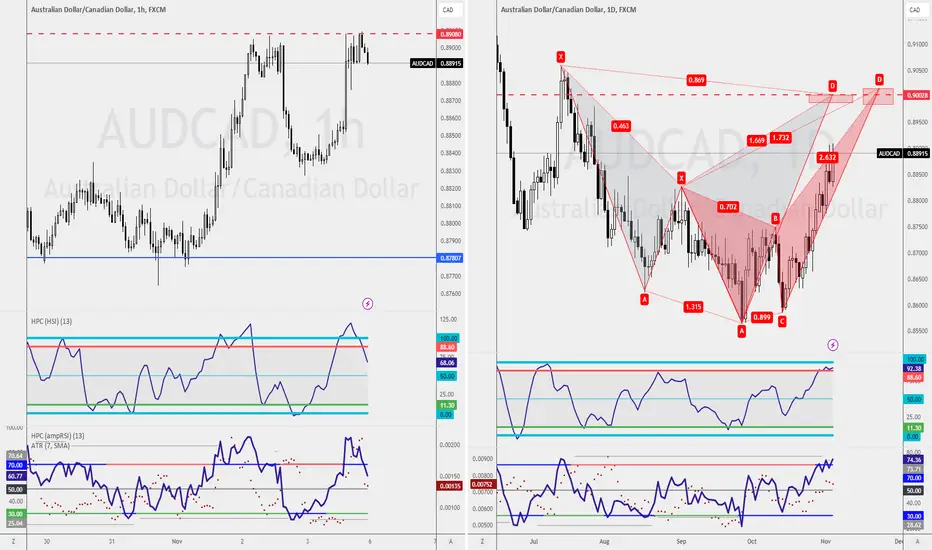
On the Daily Chart, there's a convergence of Bearish Shark and Bearish Crab Patterns, both culminating at the same completion level, 0.9015. This sets the stage for a potential shorting opportunity upon market retest at these levels.
Alternatively, consider a shorting opportunity on the 1-hourly chart, targeting the retest of the resistance level at 0.8908.
The pivotal question arises: What's your trade plan? Your insights carry weight. Please share your perspective below!
Now, attention shifts towards the potential emergence of the bearish 5-0 pattern on the Weekly Chart.
On the Daily Chart, there's a convergence of Bearish Shark and Bearish Crab Patterns, both culminating at the same completion level, 0.9015. This sets the stage for a potential shorting opportunity upon market retest at these levels.
Alternatively, consider a shorting opportunity on the 1-hourly chart, targeting the retest of the resistance level at 0.8908.
The pivotal question arises: What's your trade plan? Your insights carry weight. Please share your perspective below!
🕒 15mins workday for Young Parents
🏦 Qualify Junior Analyst within 90days
🎤 Keynote Speaker
Get into our 15mins workday community
discord.gg/AKDr9vPqH7
Live session & Trading Tips on the GO
instagram.com/raynlim/
🏦 Qualify Junior Analyst within 90days
🎤 Keynote Speaker
Get into our 15mins workday community
discord.gg/AKDr9vPqH7
Live session & Trading Tips on the GO
instagram.com/raynlim/
Related publications
Disclaimer
The information and publications are not meant to be, and do not constitute, financial, investment, trading, or other types of advice or recommendations supplied or endorsed by TradingView. Read more in the Terms of Use.