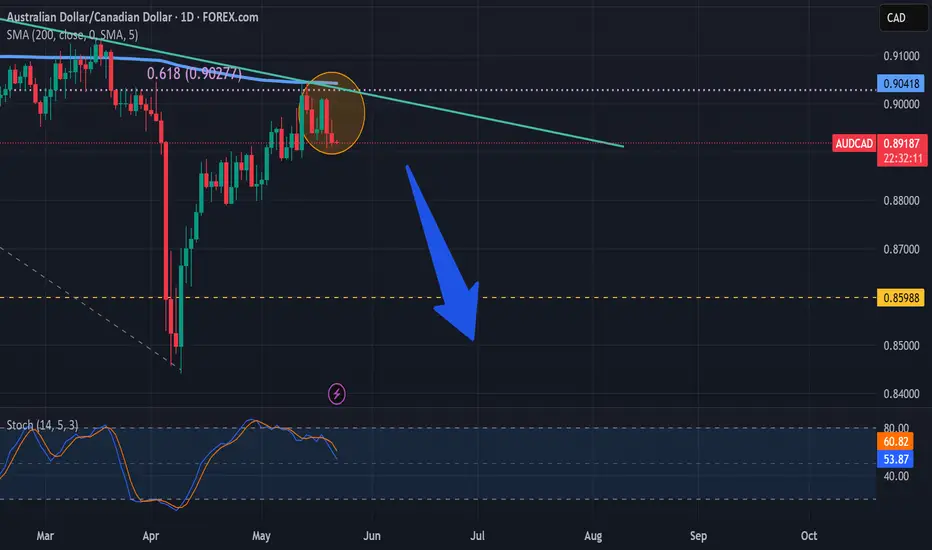
Looking pretty good for a sell based on a few technicals...
-- divergence from higher prices to stochastic K-line crossing under D -line
-- weekly candle show Spinning Top (almost a Doji) for last week
-- Daily & Weekly timeframes show price hitting 200 MA
If resistance gives way, could drop to previous low of .8441. If so, could be over 400 pips for a ~2 month period.
What do you think?!?
Disclaimer
The information and publications are not meant to be, and do not constitute, financial, investment, trading, or other types of advice or recommendations supplied or endorsed by TradingView. Read more in the Terms of Use.
Disclaimer
The information and publications are not meant to be, and do not constitute, financial, investment, trading, or other types of advice or recommendations supplied or endorsed by TradingView. Read more in the Terms of Use.