Monthly Time Frame

Weekly Time Frame

4Hour Time Frame

- Price made a bearish push until it closed as a doji candlestick found support at the weekly demand zone then made a bullish push
- After the bullish push price met resistance at a weekly supply zone ultimately forming a high. Price then began to sell off (retrace).
Weekly Time Frame
- Price met resistance, formed a double top, and closed as a doji followed by a bearish engulfing signaling a selloff.
- During the sell-off (retracement) price found support at the 61.8 fib level and closed as doji candle stick signaling a potential reversal.
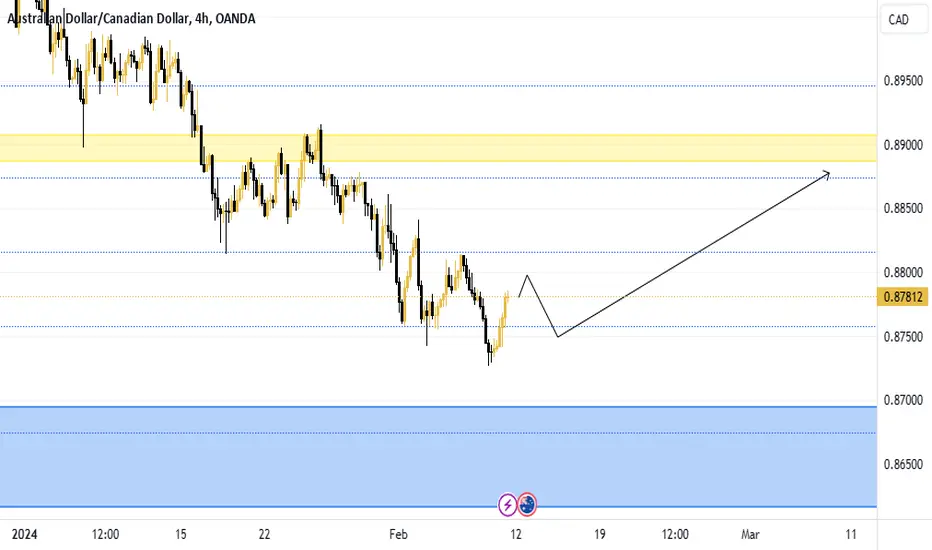
4Hour Time Frame
- I am anticipating price forming a double bottom as a candlestick reversal pattern.
- I am expecting a bullish push to 0.895
Note
Price is beginning to make its bullish push as anticapted.Disclaimer
The information and publications are not meant to be, and do not constitute, financial, investment, trading, or other types of advice or recommendations supplied or endorsed by TradingView. Read more in the Terms of Use.
Disclaimer
The information and publications are not meant to be, and do not constitute, financial, investment, trading, or other types of advice or recommendations supplied or endorsed by TradingView. Read more in the Terms of Use.